Fig. 16.
Download original image
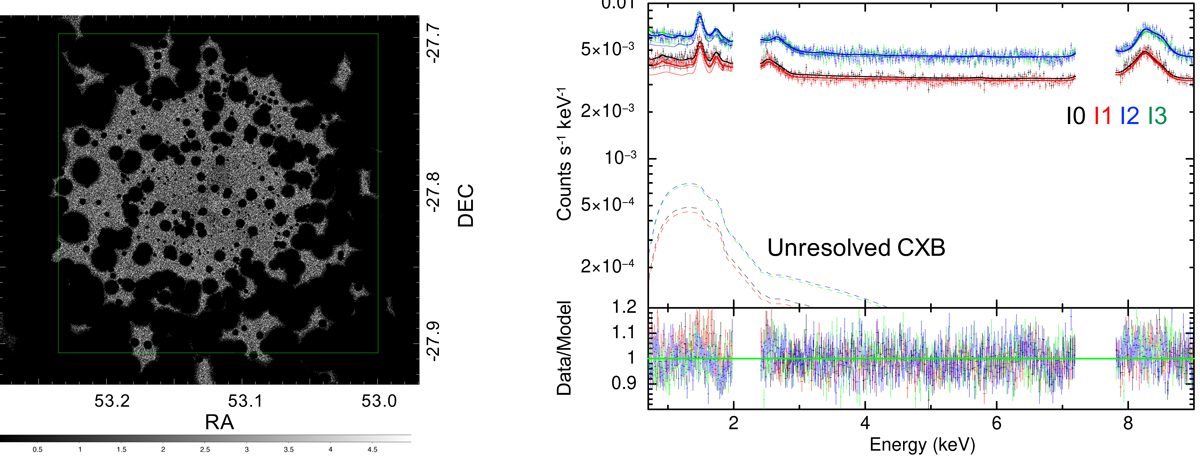
Left panel: entire CDF-S image after point-source removal. Green square is the spectral extraction region. Right panel: represents the spectral fitting result. Data (crosses) and best-fit models (thick solid lines) are shown for four ACIS-I CCDs. Upper and lower panels: indicate the count rate and data-to-model ratio, respectively. The particle-induced background models are shown with thin solid lines. The unresolved CXB models are indicated with dashed lines. The 0.7–9.0 keV range was used for the spectral fit. Two energy ranges, 2.0–2.4 keV and 7.2–7.8 keV, were excluded from analysis.
Current usage metrics show cumulative count of Article Views (full-text article views including HTML views, PDF and ePub downloads, according to the available data) and Abstracts Views on Vision4Press platform.
Data correspond to usage on the plateform after 2015. The current usage metrics is available 48-96 hours after online publication and is updated daily on week days.
Initial download of the metrics may take a while.