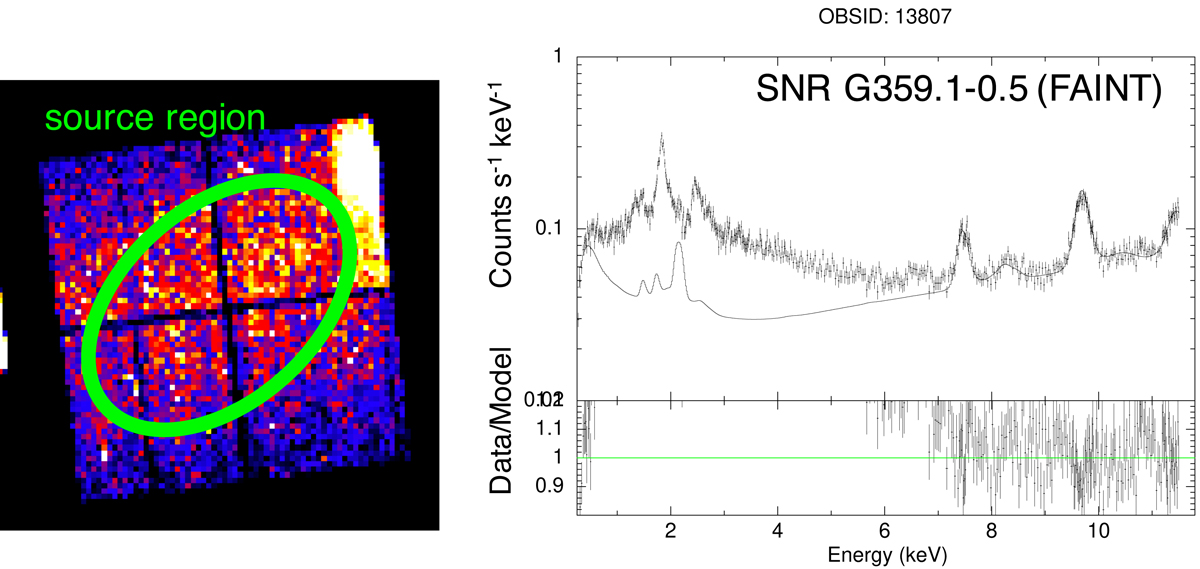
Fig. 15.
Download original image
An application of the mkacispback tool for the supernova remnant G359.1−0.5. Left panel: 0.7–5.0 keV image of the G359.1−0.5 region. The source region, which covers all the four ACIS-I CCDs, is shown with the green ellipse. Right panel: extracted spectrum and the output spectral model of mkacispback, as well as their residuals, are shown. The residuals below ∼7 keV are large because a model for the source emission has not been included here.
Current usage metrics show cumulative count of Article Views (full-text article views including HTML views, PDF and ePub downloads, according to the available data) and Abstracts Views on Vision4Press platform.
Data correspond to usage on the plateform after 2015. The current usage metrics is available 48-96 hours after online publication and is updated daily on week days.
Initial download of the metrics may take a while.