Fig. 5.

Download original image
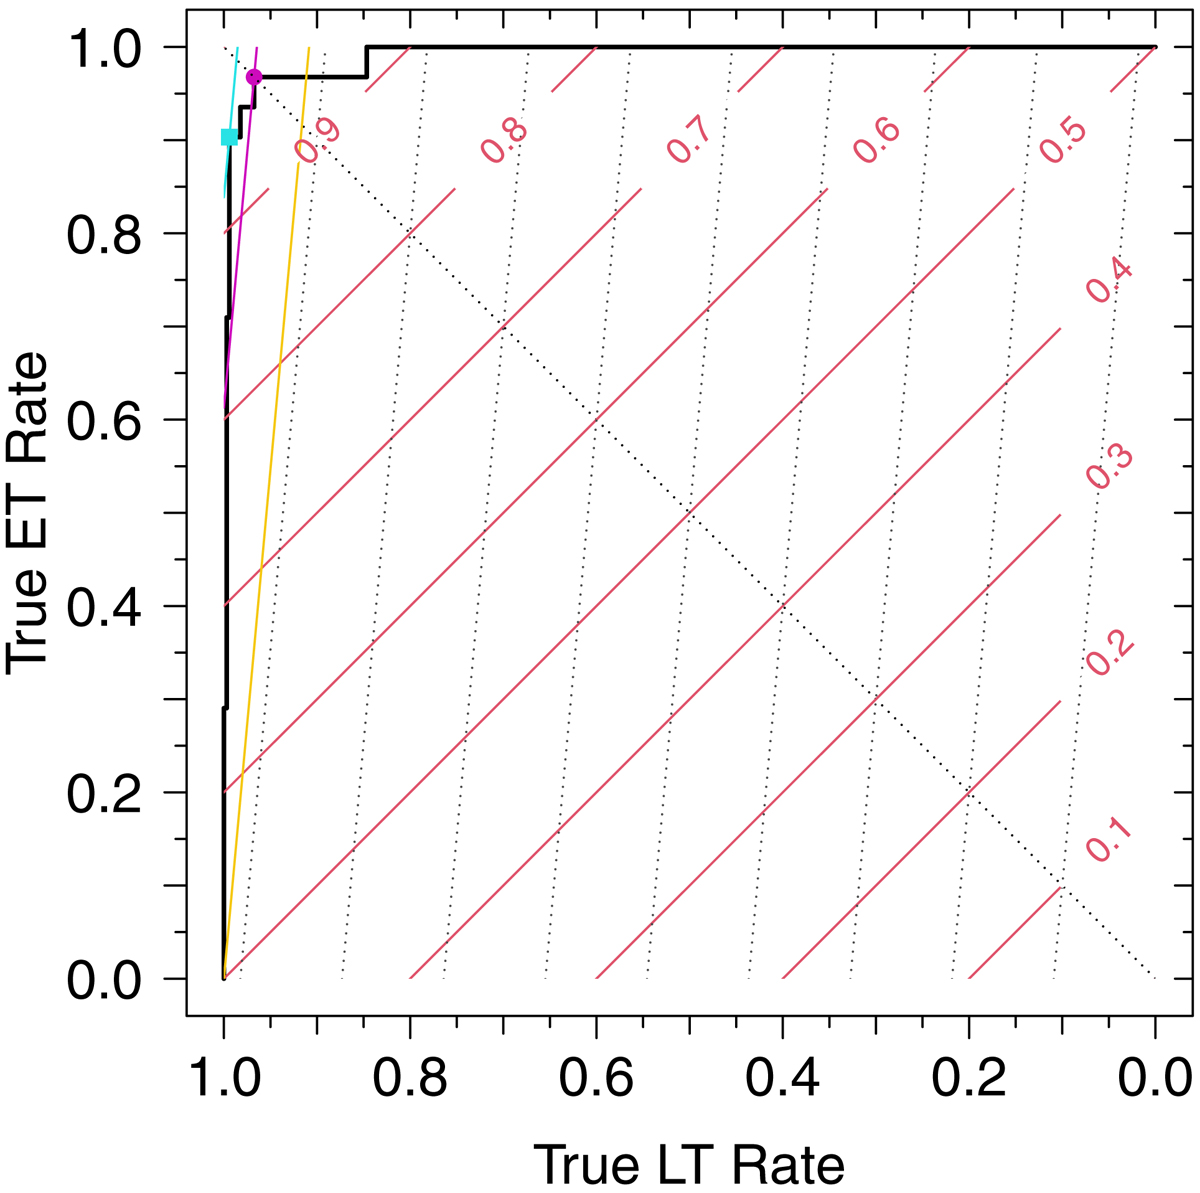
Receiver Operating Characteristic (ROC) curve for galaxy classification. For clarity, the specificity and sensitivity axes, common in statistical studies, have been renamed as True LT Rate and True ET Rate, respectively. The stepped black line is the ROC curve obtained with the neural network. The ascending diagonal red lines show the iso-accuracy edges for a balanced sample of ET and LT galaxies. Similarly, the gray dotted lines represent the iso-accuracy fringes for our imbalanced sample. Iso-accuracy lines of the same value intersect at the descending diagonal black dotted line. The orange iso-accuracy line passing through coordinates (1,0) corresponds to the baseline. The cyan square mark indicates the True LT and ET Rates obtained through the maximum accuracy criterium (0.991 and 0.90, respectively). The magenta circle indicates the rates obtained from Youden’s J statistic (0.97 for both the True LT and ET Rates).
Current usage metrics show cumulative count of Article Views (full-text article views including HTML views, PDF and ePub downloads, according to the available data) and Abstracts Views on Vision4Press platform.
Data correspond to usage on the plateform after 2015. The current usage metrics is available 48-96 hours after online publication and is updated daily on week days.
Initial download of the metrics may take a while.


