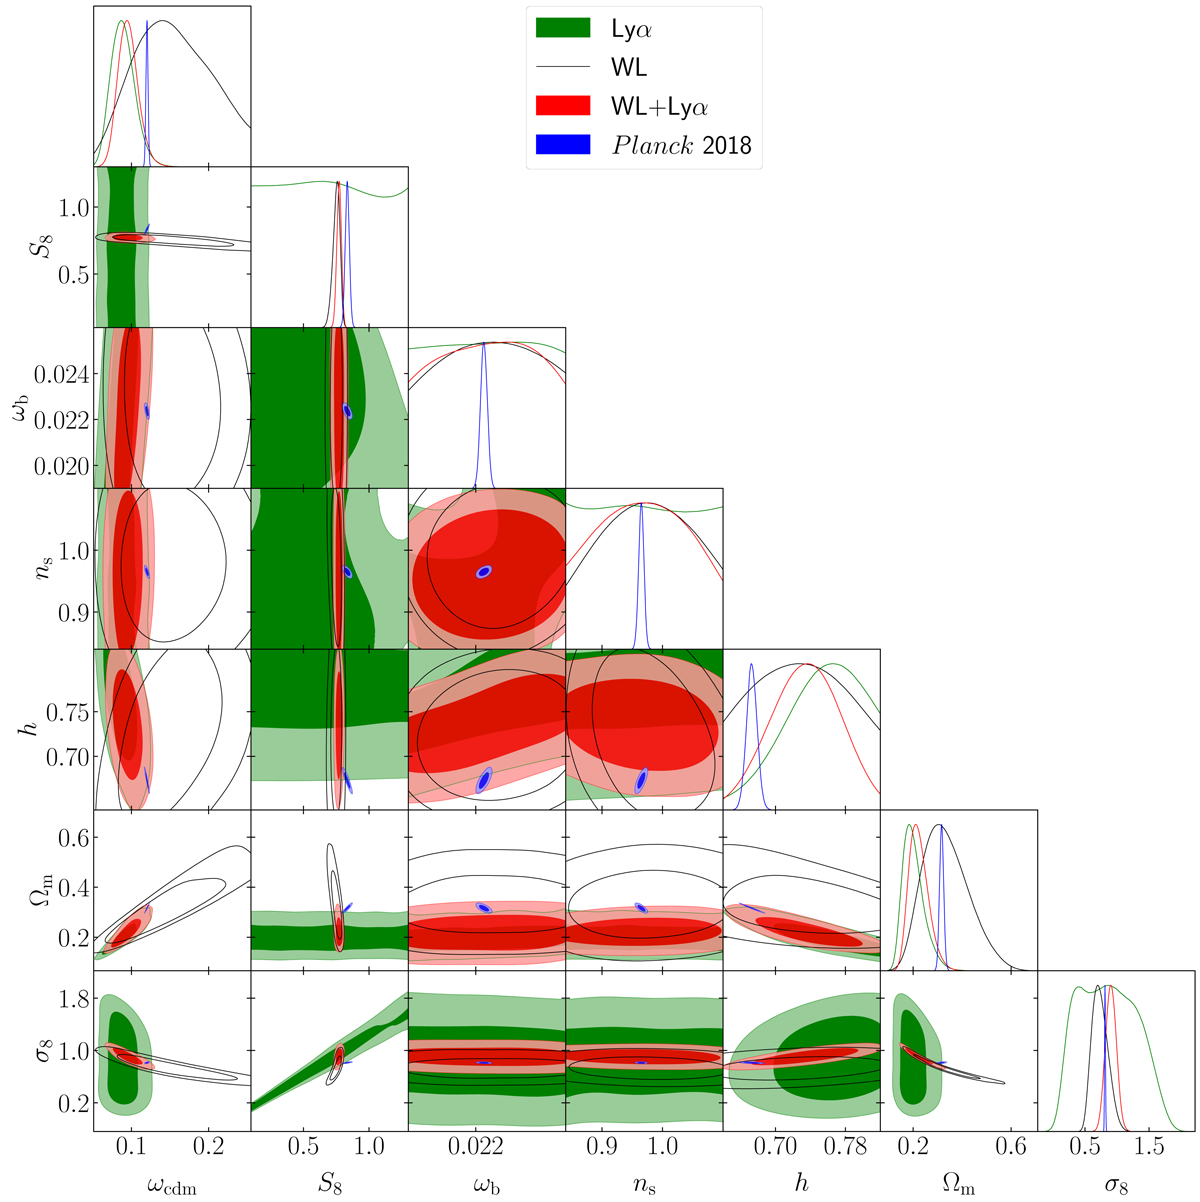
Fig. A.2.
Download original image
Marginalised posteriors distributions from the analysis of the WL and Ly-α data sets. Each panel shows the posterior resulting from a separate analysis of Lyman-α (green) and weak lensing (black) data sets as well as the combination of both data sets (red). Additionally, we show the Planck 2018 contours (Planck Collaboration VI 2020) for reference (blue).
Current usage metrics show cumulative count of Article Views (full-text article views including HTML views, PDF and ePub downloads, according to the available data) and Abstracts Views on Vision4Press platform.
Data correspond to usage on the plateform after 2015. The current usage metrics is available 48-96 hours after online publication and is updated daily on week days.
Initial download of the metrics may take a while.