Fig. 6.
Download original image
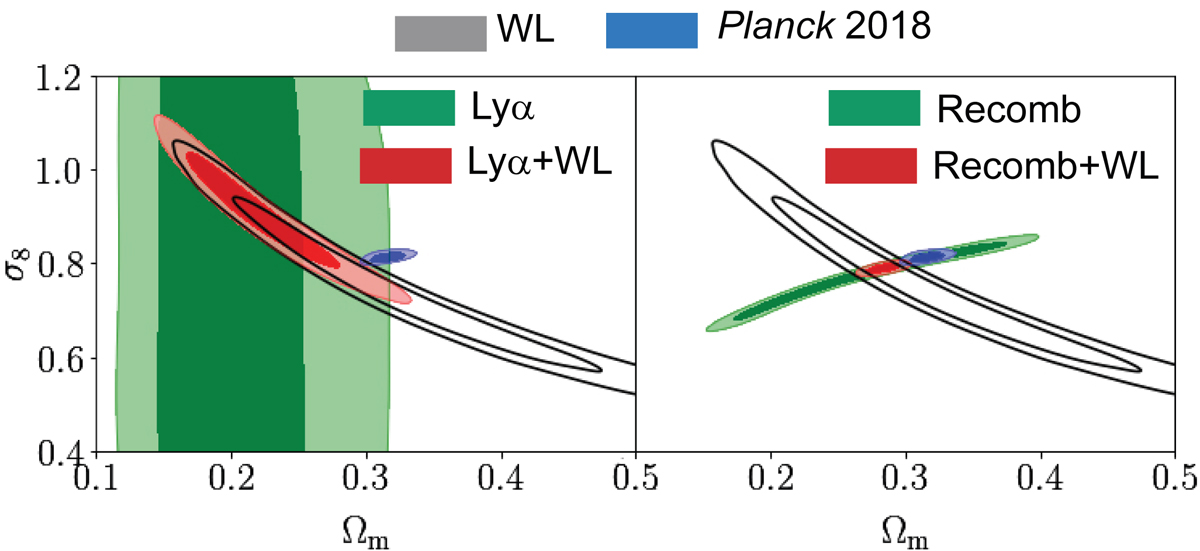
Two-dimensional constraints for the combination of parameters Ωm − σ8 of the traditional analyses of Lyα+WL data (left) and of Recomb+WL (right). In both panels the empty black contours are the WL alone constraints while the filled blue ones are the Planck contours. Left panel: green contours show the Lyα constraints while the red contours show their combination with WL. Similarly, in the right panel: green contours show the Recomb constraints while the red contours show their combination with WL. The full posterior of these analyses can be seen in Figs. A.2 and A.3 respectively.
Current usage metrics show cumulative count of Article Views (full-text article views including HTML views, PDF and ePub downloads, according to the available data) and Abstracts Views on Vision4Press platform.
Data correspond to usage on the plateform after 2015. The current usage metrics is available 48-96 hours after online publication and is updated daily on week days.
Initial download of the metrics may take a while.