Fig. 5.
Download original image
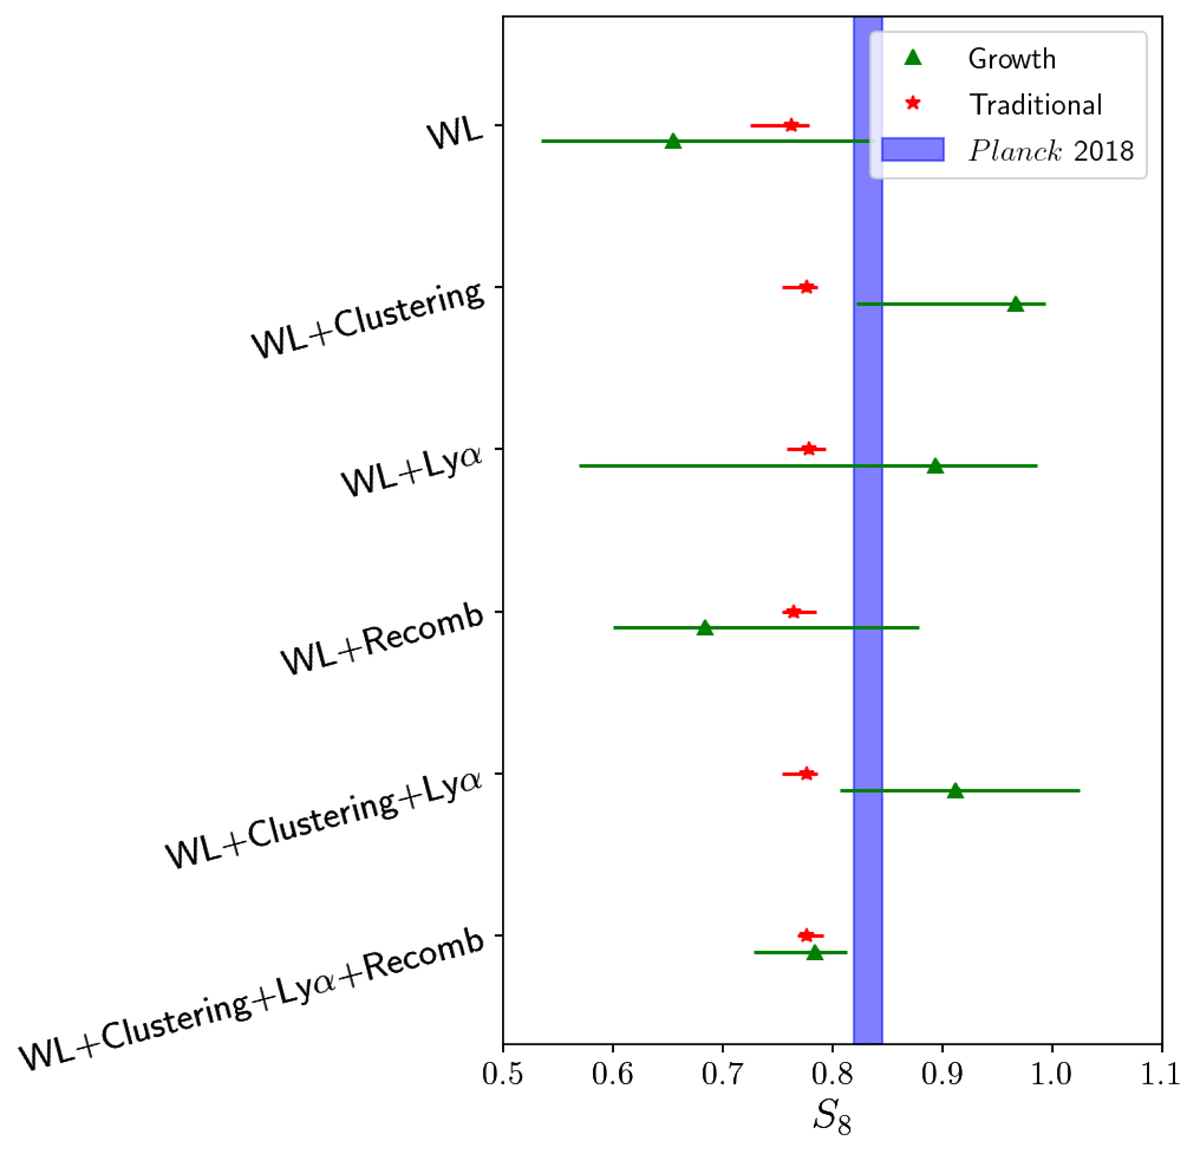
S8 best-fit parameter values with their associated 1σ confidence regions obtained from the different combinations of data sets explored in this work. In top to bottom order we display the data sets WL, WL + Clustering, WL + Lyα, WL + Recomb, WL + Clustering + Lyα and finally WL + Clustering + Lyα + Recomb. The numerical value of the quantities displayed can be found in Table 5.
Current usage metrics show cumulative count of Article Views (full-text article views including HTML views, PDF and ePub downloads, according to the available data) and Abstracts Views on Vision4Press platform.
Data correspond to usage on the plateform after 2015. The current usage metrics is available 48-96 hours after online publication and is updated daily on week days.
Initial download of the metrics may take a while.