Fig. 3.
Download original image
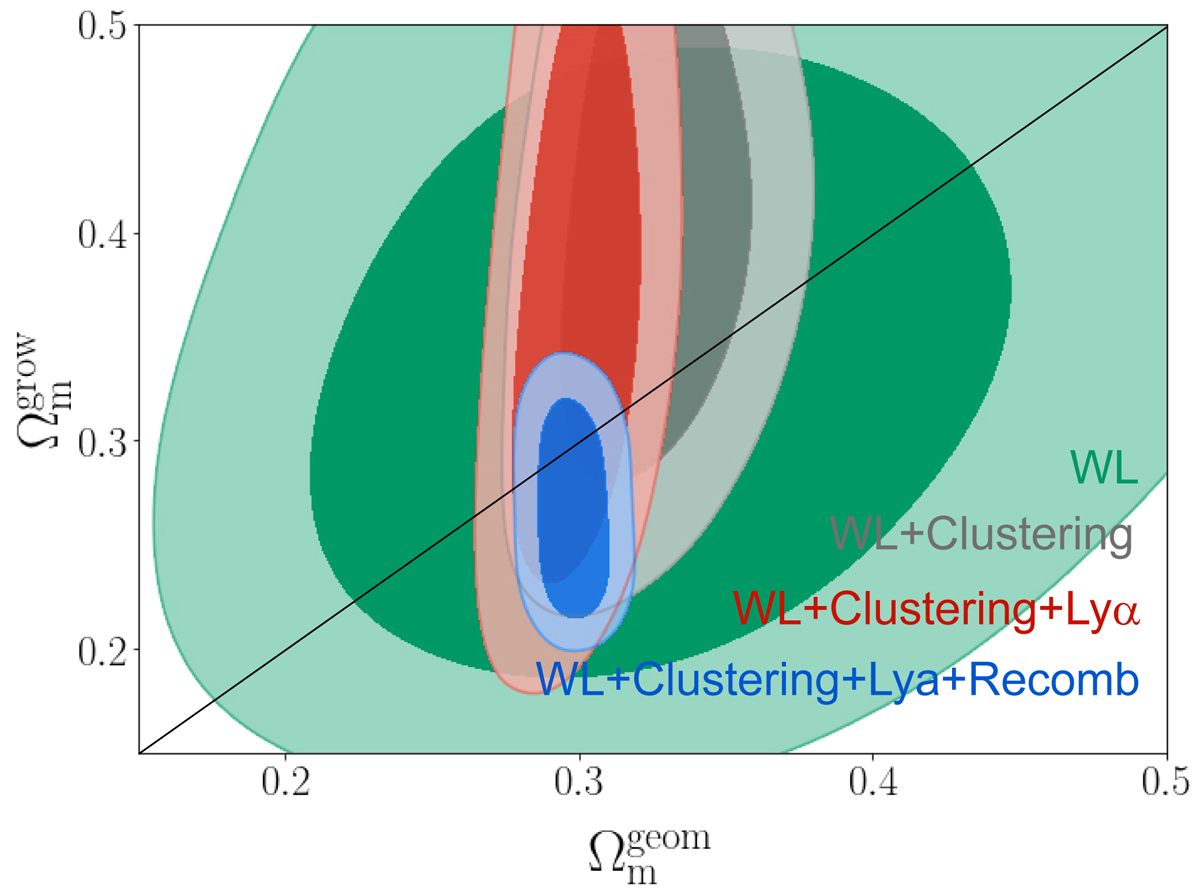
Marginalised posterior for Ωm when comparing their geometry (horizontal axis) and growth (vertical axis) counterparts. We show the evolution of the contours as more data sources are added into the analysis. Namely, we display weak lensing (green), weak lensing combined with clustering data (grey), weak lensing combined with clustering and Lyman-α forest data (red) and finally weak lensing combined with clustering, Lyman-α forest and Recomb data (blue).
Current usage metrics show cumulative count of Article Views (full-text article views including HTML views, PDF and ePub downloads, according to the available data) and Abstracts Views on Vision4Press platform.
Data correspond to usage on the plateform after 2015. The current usage metrics is available 48-96 hours after online publication and is updated daily on week days.
Initial download of the metrics may take a while.