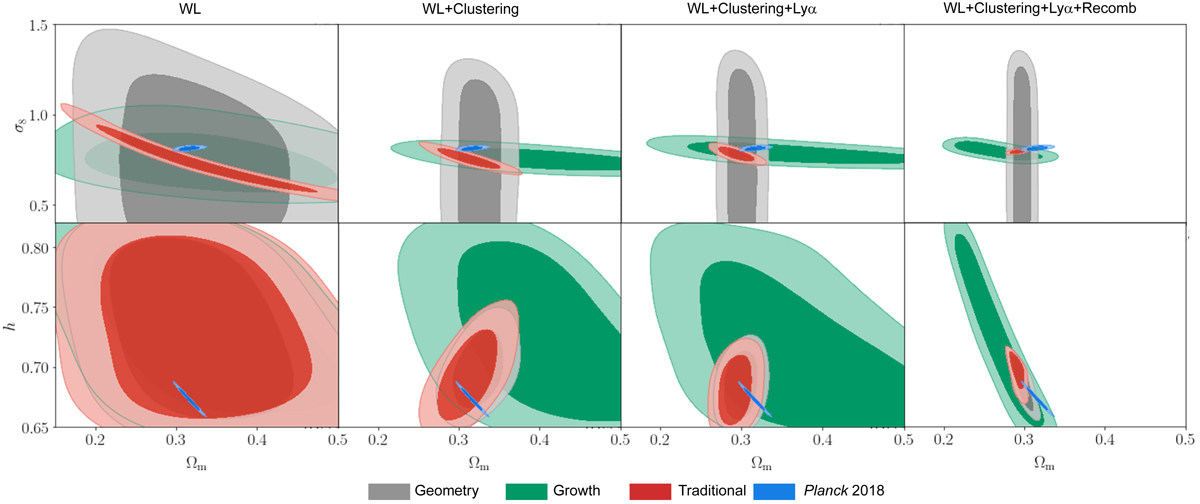
Fig. 2.
Download original image
Marginalised posterior distributions of σ8 and Ωm (top row), as well as h and Ωm (bottom row) for different combinations of data sets (columns). Each panel shows a superposition of four contours. Namely, the growth and geometry contours from the split analysis of the two theory regimes (green and grey contours respectively), the contour resulting from the traditional analysis with one set of cosmological parameters (red), and the reference contours from the Planck 2018 analysis (blue; Planck Collaboration VI 2020).
Current usage metrics show cumulative count of Article Views (full-text article views including HTML views, PDF and ePub downloads, according to the available data) and Abstracts Views on Vision4Press platform.
Data correspond to usage on the plateform after 2015. The current usage metrics is available 48-96 hours after online publication and is updated daily on week days.
Initial download of the metrics may take a while.