Fig. 2.
Download original image
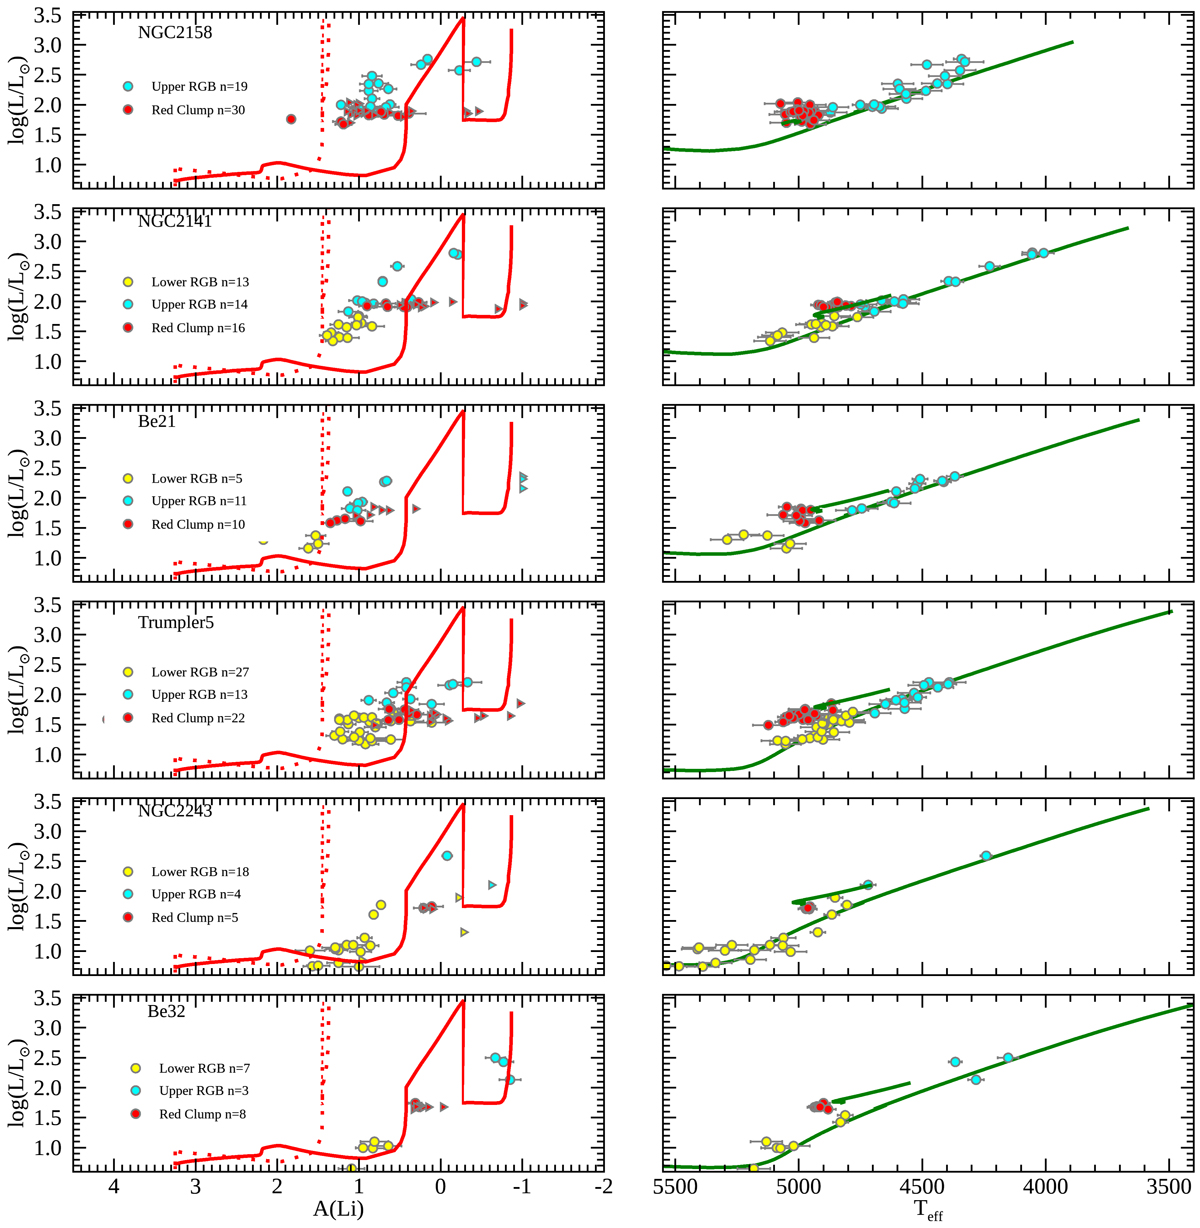
Lithium abundance and stellar parameters of member stars in our sample clusters. Left panels: log(L/L⊙) versus A(Li); yellow circles are lower RGB stars – prior to the RGB bump –, cyan circles are upper RGB stars – after the bump – and red circles are RC stars. The red continuous curves are the models with rotation-induced mixing at solar metallicity for 1.5 M⊙. The red dotted curves are the classical models with only convection from Lagarde et al. (2012). Right panels: HR diagrams with the PARSEC isochrones (Bressan et al. 2012) at the age and metallicity of each cluster. The error bars on luminosity are of the order of the symbol size.
Current usage metrics show cumulative count of Article Views (full-text article views including HTML views, PDF and ePub downloads, according to the available data) and Abstracts Views on Vision4Press platform.
Data correspond to usage on the plateform after 2015. The current usage metrics is available 48-96 hours after online publication and is updated daily on week days.
Initial download of the metrics may take a while.