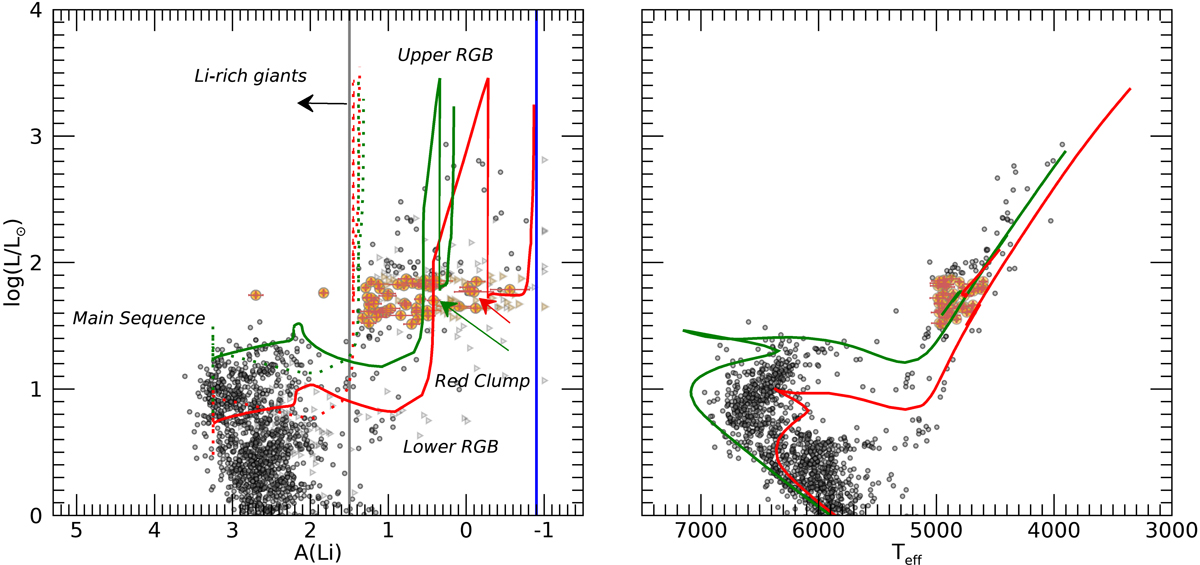
Fig. 1.
Download original image
Lithium abundance and stellar parameters of member stars of open clusters with 1 M⊙ ≤ M ≤ 1.8 M⊙ and −0.2 ≤ [Fe/H] ≤ 0.2. Left panel: log(L/L⊙) versus A(Li); grey circles show the whole sample of member stars and coloured circles the stars at the RC. Triangles show the upper limits on A(Li). The red and green continuous curves are the RT models at solar metallicity for 1.5 M⊙ and 2 M⊙, respectively, while the red and green dotted curves are the classical models for the same masses from Lagarde et al. (2012). The vertical black line indicates the limit for Li-rich giants A(Li) ≥ 1.5 dex, while the vertical blue line at A(Li) ≥ −0.9 dex shows the RC-RGB limit of Kumar et al. (2020). The locations of the RC in the RT models of Lagarde et al. (2012) are shown with arrows. Right panel: HR diagram with the sample stars and the PARSEC isochrones for 1.5 and 2.0 M⊙, in red and green, respectively, at solar metallicity.
Current usage metrics show cumulative count of Article Views (full-text article views including HTML views, PDF and ePub downloads, according to the available data) and Abstracts Views on Vision4Press platform.
Data correspond to usage on the plateform after 2015. The current usage metrics is available 48-96 hours after online publication and is updated daily on week days.
Initial download of the metrics may take a while.