Fig. A.6.
Download original image
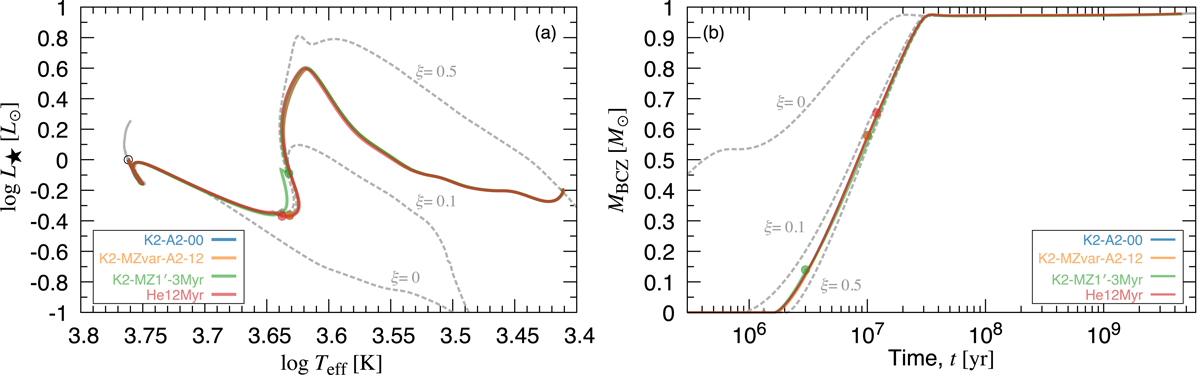
Evolutionary tracks on the Hertzsprung-Russell diagram (left panel) and time evolution of the mass coordinate of the base of the CZ MBCZ (right), for models K2 with A2 = 0 (blue line), K2-MZvar with A2 = 0.12 (orange line), K2-MZ1′ with fovershoot = 0.01 and tacc = 3 Myr (green line), and He12Myr (red line) (see Table 1). The filled circles indicate the times at which accretion ends. The open circle in the left panel indicates the position of the Sun. The gray dashed lines show the evolutionary tracks obtained by Kunitomo et al. (2018, for ξ = 0.5, 0.1, and 0).
Current usage metrics show cumulative count of Article Views (full-text article views including HTML views, PDF and ePub downloads, according to the available data) and Abstracts Views on Vision4Press platform.
Data correspond to usage on the plateform after 2015. The current usage metrics is available 48-96 hours after online publication and is updated daily on week days.
Initial download of the metrics may take a while.