Free Access
Fig. A.2.
Download original image
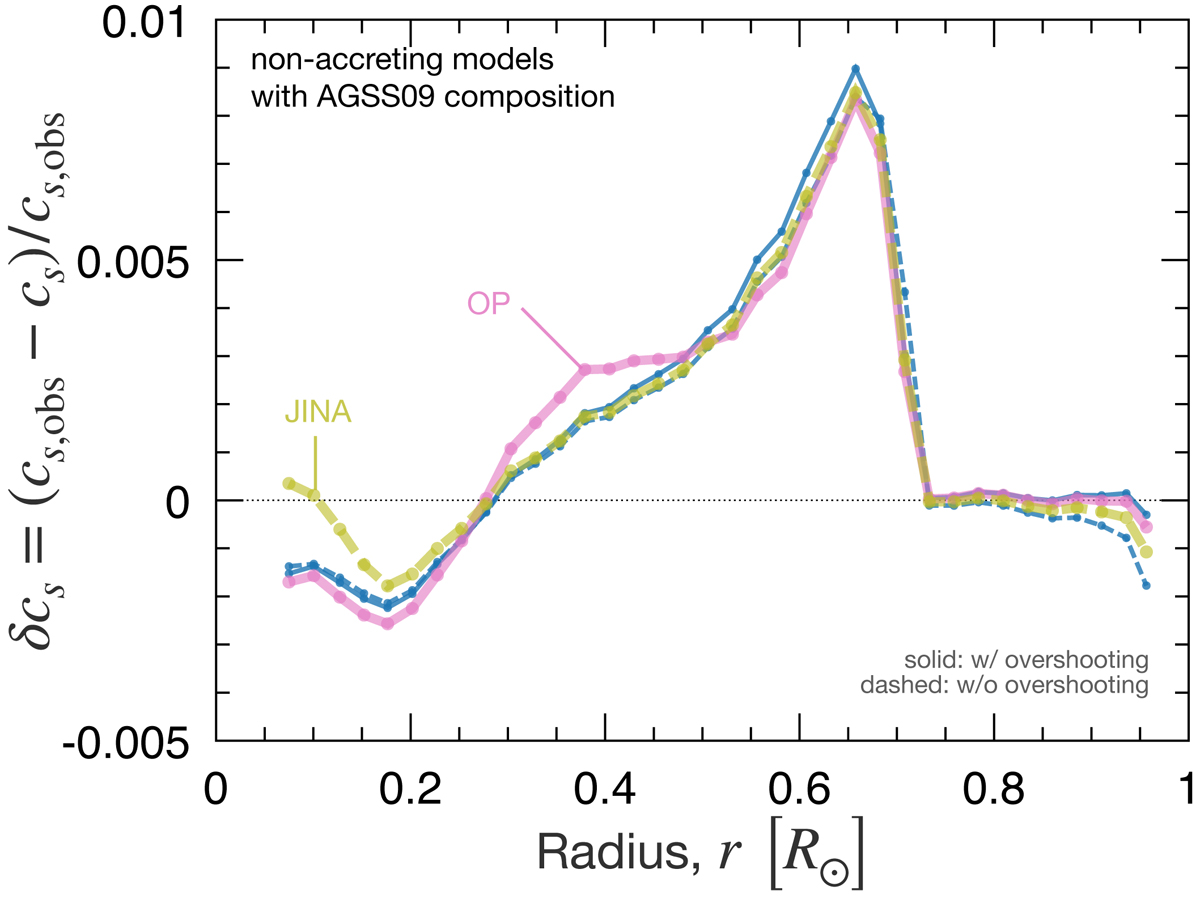
Same as Fig. A.1(b) (i.e., non-accreting models with the AGSS09 composition). The pink and gold lines indicate the cases with the OP opacity table (with overshooting) and JINA nuclear reaction table (without overshooting), respectively. The thin blue lines are the same as the thick blue lines in Fig. A.1(b).
Current usage metrics show cumulative count of Article Views (full-text article views including HTML views, PDF and ePub downloads, according to the available data) and Abstracts Views on Vision4Press platform.
Data correspond to usage on the plateform after 2015. The current usage metrics is available 48-96 hours after online publication and is updated daily on week days.
Initial download of the metrics may take a while.