Fig. B.3
Download original image
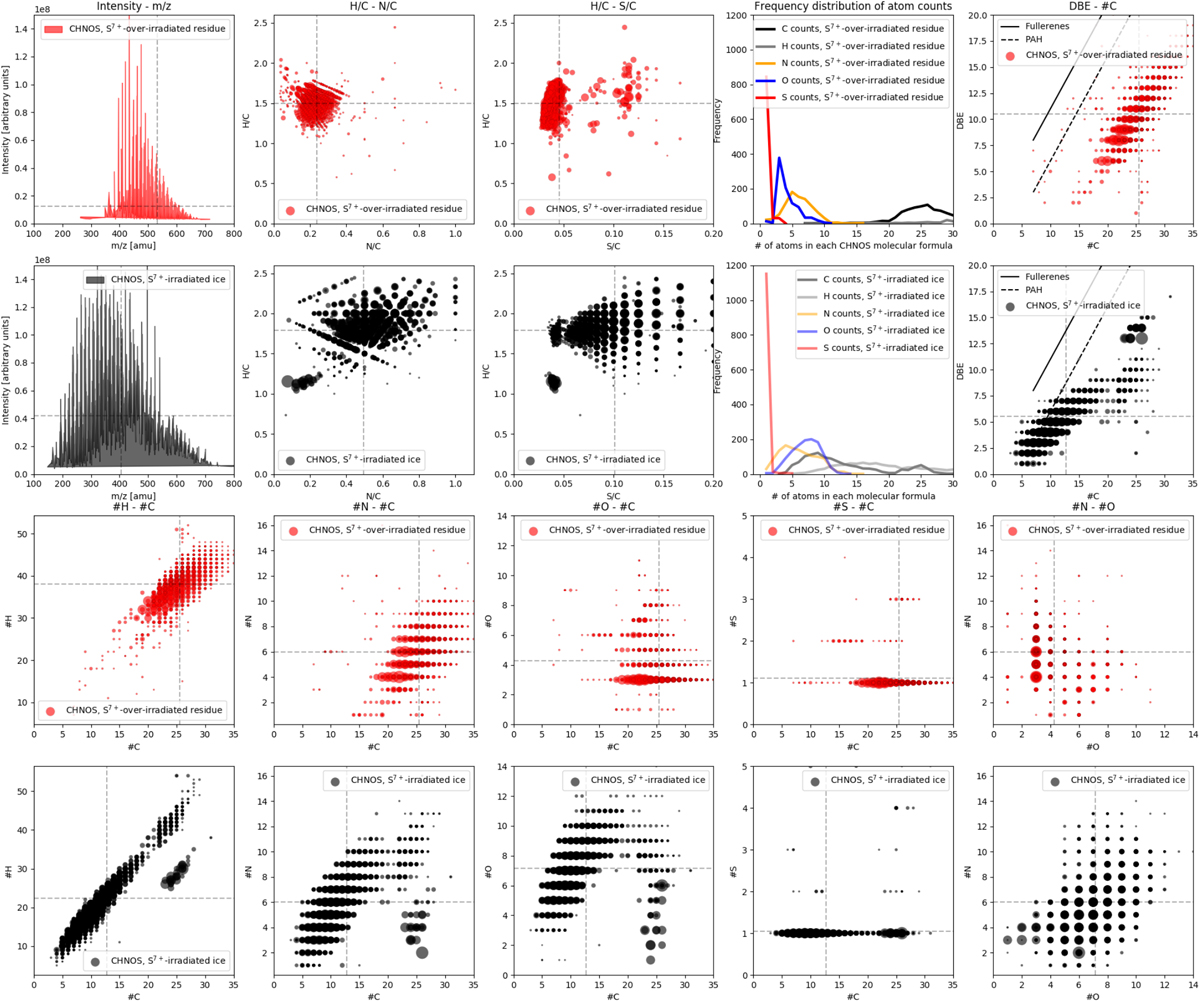
Characteristics of CHNOS compounds formed on residues (red, 1st and 3r row) or inside ices (black, 2nd and 4th row) - detailed plots. 1st-2nd row, from left to right: Intensity-m/z, H/C-N/C, H/C-S/C plots, frequency distribution of atom counts, DBE-#C plot. 3rd/4th row; from left to right: #H-#C, #N-#C, #O-#C, #S-#C and #N-#O plots. Dashed lines represent mean values.
Current usage metrics show cumulative count of Article Views (full-text article views including HTML views, PDF and ePub downloads, according to the available data) and Abstracts Views on Vision4Press platform.
Data correspond to usage on the plateform after 2015. The current usage metrics is available 48-96 hours after online publication and is updated daily on week days.
Initial download of the metrics may take a while.