Fig. B.6
Download original image
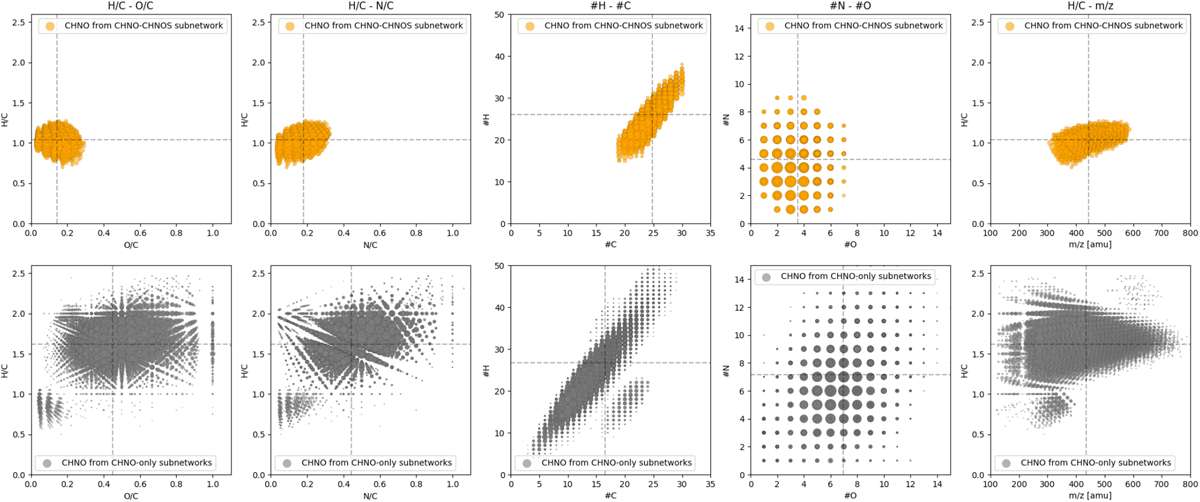
CHNO compound characteristics differentiating CHNOS precursors (1st row, orange) and non-CHNOS precursors (2nd row, gray). From left to right: H/C-O/C, H/C-N/C, #H-#C, #N-#O, H/C-m/z plots. Two groups of CHNO compounds (CHNOS precursors (direct and indirect ones), orange, and non-CHNOS precursors, gray) have been identified via molecular network analysis (see details in main text "CHNO-CHNOS molecular network" and Methods section "Molecular network analysis"). Dashed lines represent mean values.
Current usage metrics show cumulative count of Article Views (full-text article views including HTML views, PDF and ePub downloads, according to the available data) and Abstracts Views on Vision4Press platform.
Data correspond to usage on the plateform after 2015. The current usage metrics is available 48-96 hours after online publication and is updated daily on week days.
Initial download of the metrics may take a while.