| Issue |
A&A
Volume 655, November 2021
|
|
|---|---|---|
| Article Number | A60 | |
| Number of page(s) | 14 | |
| Section | Extragalactic astronomy | |
| DOI | https://doi.org/10.1051/0004-6361/202141186 | |
| Published online | 19 November 2021 | |
Distribution of the coronal temperature in Seyfert 1 galaxies
Institute for Astronomy Astrophysics Space Applications and Remote Sensing (IAASARS), National Observatory of Athens, I. Metaxa & V. Pavlou, Penteli 15236, Greece
e-mail: This email address is being protected from spambots. You need JavaScript enabled to view it.
Received:
26
April
2021
Accepted:
2
August
2021
Abstract
Active galactic nuclei (AGN) produce copious amounts of X-rays through the corona, the region of hot gas that lies close to the accretion disk. The temperature of the corona can be accurately determined by the cut-off signature in the X-ray spectrum. Owing to the high temperatures in the corona, observations well above 10 keV are necessary. Here, we explore the NuSTAR observations of 118 Seyfert 1 AGN selected using Gehrels/Swift. We modelled the spectrum using a single power-law with an exponential cut-off modified by neutral and ionised absorption as well as a reflection component. We found secure spectral cut-off estimates in 62 sources, while for the remaining ones, we derived only the lower limits. The resulting mean value is 103 keV, with a skewed distribution towards large energies with a large dispersion. When we consider the lower limits using survival analysis techniques, the mean cut-off energy becomes significantly larger, that is, about 200 keV. Because of various limitations (e.g., limited spectral passband, photon statistics, model degeneracies), we performed extensive simulations to explore the underlying spectral cut-off distribution. We find that an intrinsic spectral cut-off distribution, which has a Maxwell-Boltzmann shape with a mean value in the range of 160–200 keV, can reproduce the observations sufficiently well. Finally, our spectral analysis places very stringent constraints on both the photon index (Γ = 1.77 ± 0.01) as well as on the reflection component (R = 0.69 ± 0.04) of the Seyfert 1 population. From the values of the spectral cut-off and the photon-index, we deduce that the mean optical depth of the AGN corona is approximately τe = 1.82 ± 0.14 and its mean temperature is approximately kTe = 65 ± 10 keV.
Key words: X-rays: general / quasars: supermassive black holes / galaxies: Seyfert / galaxies: active
© ESO 2021
1. Introduction
Accreting supermassive black holes (SMBH) or active galactic nuclei (AGN) produce large amounts of radiation primarily in the UV and optical wavelengths. This radiation is believed to be produced in an optically thick accretion disk formed by material infalling towards the black hole. Furthermore, X-ray radiation is a ubiquitous feature of AGN (Brandt & Alexander 2015). The X-ray continuum is produced in a region of hot plasma called the corona. The X-rays are produced as hot electrons scatter the UV photons coming from the accretion disk through inverse Compton scattering (Vaiana & Rosner 1978; Haardt & Maraschi 1991). The rapid X-ray variability observed (e.g., McHardy et al. 2005; Ludlam et al. 2015) as well as the reverberation of the X-ray radiation reprocessed by the accretion disk, which is the so-called reflection component, (Emmanoulopoulos et al. 2014; Uttley et al. 2014; Kara et al. 2016) suggest that the corona is small in size (several times the gravitational radius of the black hole). These findings have been confirmed via microlensing studies (e.g., Chartas et al. 2016; Guerras et al. 2017).
Broad-band X-ray spectroscopy of the X-ray emission can provide important constraints on the physical parameters of the coronal gas. In particular, the temperature, kTe, in combination with the optical depth, τe, determines the slope of the power-law spectrum (e.g., Petrucci et al. 2001). The higher the optical depth, the flatter the X-ray continuum at a given temperature of the corona. The X-ray broad-band spectrum is usually parameterised as E−Γe−E/Ec, where E is the photon energy, Γ is the photon index, and Ec is the spectral energy cut-off that accurately measures the temperature of the corona. However, it is challenging to determine the value of the spectral cut-off as this requires observations that are well above 10 keV. The spectral cut-off was measured directly for the first time using the Compton Gamma-ray observatory. It was found that the spectral cut-off in NGC4151 is around 100 keV (Johnson et al. 1997). The BeppoSAX mission further increased the number of the spectral cut-off measurements (Dadina 2007). More recently, a large number of observations were acquired using either the INTEGRAL or the Gehrels Swift missions. Malizia et al. (2014) presented the INTEGRAL spectra of a sample of Seyfert 1 galaxies, thereby securely detecting the cut-off energy in 26 sources. They find an average high energy cut-off of 128 keV, with a standard deviation of 46 keV. Ricci et al. (2017) carried out the most comprehensive X-ray spectral analysis of AGN in the local Universe, presenting the X-ray spectra of all the AGN detected in the Gehrels Swift/BAT survey. Among them, there are 352 unobscured AGN (NH < 1022 cm−2). In 89 sources, the spectral cut-off could be securely inferred (no censored values, i.e. no upper or lower limits), with a mean value of 80 ± 7 keV. Taking into account all the sources, that is, also including lower and upper limits by means of survival analysis techniques, these authors established a mean cut-off energy of 331 ± 29 keV. This value is substantially higher than that derived by Malizia et al. (2014).
The launch of the NuSTAR mission (Harrison et al. 2013) facilitated a leap forward in the study of the high-energy spectra of AGN, owing to its excellent spatial resolution above 10keV. The NuSTAR observations of the cut-off of AGN include Fabian et al. (2015), Kamraj et al. (2018), Molina et al. (2019), Rani et al. (2019). In analysing a sample of 18 Seyfert 1 galaxies, Molina et al. (2019) used 13 secure measurements plus five lower limits and found a mean value for the cut-off of Ec = 111 keV with a dispersion of 45 keV. Rani et al. (2019) presented a sample of eight Seyfert 1 AGN with securely derived cut-off. This sample yields a mean cut-off value of 95 keV with a dispersion of 32 keV. Recently, Hinkle & Mushotzky (2021) derived the coronal parameters of 33 Gehrels/Swift AGN including XMM-Newton and NuSTAR observations. The mean cut-off value is 122 keV for the 19 Seyfert-1 galaxies. Finally, Baloković et al. (2020) presented the NuSTAR spectra of 130 Seyfert 2 galaxies selected by Gehrels Swift and found a median cut-off of 290 ± 20 keV.
It becomes evident that there are still significant uncertainties in the value of the spectral cut-off and, hence, the temperature of the corona. This is partly due to the presence of a considerable fraction of lower limits amongst some of the above samples. Moreover, there is a considerable spread in the values of the cut-offs even amongst the securely constrained values. It is not clear whether this large spread reflects the intrinsic dispersion of AGN coronal temperatures or, alternatively, whether it can be attributed to the limited photon statistics and the relatively limited pass-band of even the hard-energy detectors. In this paper we are trying to overcome this impasse by exploring the X-ray spectroscopic analysis, with NuSTAR, of the largest sample of Seyfert 1 galaxies presented so far. The Seyfert 1 sample comes from the 107-month Gehrels Swift/BAT sample of Oh et al. (2018). Our primary goal is to derive the intrinsic X-ray spectral cut-off distribution. A key feature of our analysis is that we present detailed simulations in order to take into account all systematics that affect the determination of the spectral cut-off. Together with the robust estimation of the spectral cut-off, our spectral modelling provides strong constraints on the photon index distribution as well as on the strength of the reflection component. Throughout the paper, we adopt the standard cosmological parameters Ho = 70 km s−1 Mpc−1, Ωm = 0.3, ΩΛ = 0.7.
2. Our sample
Here, we compile the archival Nuclear Spectroscopic Telescope Array (NuSTAR) observations of the Seyfert 1 galaxies detected in the 105-month survey of the Burst Alert Telescope (BAT, Barthelmy 2004) survey on board the Gehrels Swift Gamma-Ray Burst observatory (Gehrels et al. 2004). The 105-month BAT survey (Oh et al. 2018) is a uniform, hard X-ray, all-sky survey with a sensitivity of 8.40 × 10⁻¹² erg s−1 cm−2 over 90% of the sky and 7.24 × 10⁻¹² erg s−1 cm−2 over 50% of the sky, in the 14 − 195 keV band. The BAT 105-month catalogue provides 1632 hard X-ray sources in the 14 − 195 keV band above the 4.8σ significance level. Since the launch of its operations in 2012, the NuSTAR satellite has been taking frequent observations of AGNs selected from the Gehrels Swift/BAT hard X-ray catalogue.
Launched in June 2012, NuSTAR (Harrison et al. 2013) is the first orbiting X-ray observatory that focusses light at high energies (E > 10 keV). It consists of two co-aligned focal plane modules (FPMs) that are identical in design. Each FPM covers the same 12 × 12 arcmin portion of the sky and comprises of four Cadmium-Zinc-Tellurium detectors. NuSTAR operates between 3 and 79 keV and provides an improvement of at least two orders of magnitude in sensitivity compared to previous hard X-ray observatories operating at energies of E > 10 keV. We take advantage of NuSTAR’s unprecedented sensitivity above 10 keV to measure the distribution of the high energy cut-off of the Seyfert 1 population in the local universe.
In the 105-month Gehrels Swift/BAT hard X-ray catalogue, there is a total of 370 Seyfert 1 galaxies, including type 1.0 (163 AGN) type 1.2 (96 AGN) and type 1.5 (111 AGN). Up until recently, there have been observed in total 142 of these Gehrels Swift/BAT Seyfert 1 with NuSTAR. We note that the majority of the sources observed by NuSTAR belong to the 70-month BAT catalogue (Baumgartner et al. 2013) while only an additional four come from the 105-month catalogue. The effective energy range of NuSTAR detectors (3–79 keV) does not allow for an accurate measurement of the lower NH hydrogen column densities. Despite the fact that NuSTAR is not sensitive to soft X-rays below 3 keV, even moderate column densities could easily absorb the X-ray photons within its passband. For example, assuming a power-law spectrum with a photon index Γ = 1.8, a column density of NH = 1022 cm−2 reduces the NuSTAR flux in the 3–10 keV band by ∼4%. If the column density NH becomes 5 × 1022 cm−2, then the reduction of the 3–10 keV flux becomes ∼18%. In order to minimise the effect of the photo-electric absorption at the lower part of the X-ray spectrum, we focus only on the X-ray unobscured Seyfert 1 galaxies (i.e. NH < ×1022 cm−2). This is important since the degeneracy between the photon index and the column density may affect the cut-off energy measurements.
Ricci et al. (2017) have provided accurate measurements of the X-ray absorption by using XMM-Newton, Swift/XRT, ASCA, Chandra, and Suzaku observations in the soft X-ray band (< 10 keV) with the 70-month averaged Swift/BAT data. Based on their results, we excluded 20 sources showing NH > 1 × 1022 cm−2 from the analysis. Our final sample is comprised of 122 sources. The observational details of the sample are listed in Table A.1 in increasing BAT obsID order. The source name, redshift, and optical classification type was obtained from the 105-month BAT survey catalogue. The NuSTAR observation identifier used in the analysis is also shown. When multiple observations were present, we chose to analyze the observation with the highest exposure. Lastly, the net counts of each observation calculated from the combined (FMPA and FMPB) observations are also presented.
3. X-ray spectral analysis
3.1. X-ray spectral reduction
We performed a spectral reduction for both NuSTAR modules, FPMA, and FPMB, using the NuSTAR Data Analysis Software (NUSTARDAS; version 1.2.1), within the HEASOFT (version 6.16). We extracted source and background energy spectra from the calibrated and cleaned event files using the NUPRODUCTS module. Detailed information on the data reduction procedures can be found in the NuSTAR Data Analysis Software Guide (Perri & Puccetti 2017). An extraction radius of 60″ was used for both the source and background regions. The background spectrum was estimated from several source-free regions of the image at an off-axis angle similar to the source position. The spectral files were re-binned using the HEASOFT task GRPPHA to give a minimum of 20 photon counts per bin. In Fig. 1, we present the background-subtracted count distribution of our observations from both FPMA and FPMB instruments to depict the excellent statistical quality of the spectra. The minimum number of the background subtracted (FMPA & FMPB) counts is 550 and corresponds to the source with BAT obsID 495, while BAT source 694 show the maximum number of 697782 counts.
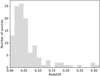 |
Fig. 1. Redshift distribution of the 122 sources in the final sample. |
3.2. Spectral fitting
The spectral fitting was carried out using XSPEC v12.8.2 (Arnaud et al. 1996). We simultaneously fit the spectra from both the FMPA and FMPB instruments. We fit the data using the PEXMON model in XSPEC (Nandra et al. 2007). This describes an exponentially cut-off power-law spectrum, reflected by a neutral material slab and takes into account the self-consistently generated narrow Fe K lines. The relative reflection strength is parameterised by R, where R = 1 corresponds to a semi-infinite slab seen at an inclination angle of θ and subtends a 2π solid angle at the X-ray source. We take both neutral and ionised absorption into account. Although we already discarded all sources with absorption above 1022 cm−2 (as found by Ricci et al. 2017), we check for possible variability in the column densities. The neutral absorption column density is modelled using the ZPHABS model in XSPEC. Regarding the ionised absorption, the hard spectral band of NuSTAR, which excludes energies below 3 keV, does not allow us to easily constrain any possible ionised absorption features. Using softer X-ray data, Ricci et al. (2017) find evidence for ionised absorption in 33 sources from our sample. This was found using the ZXIPCF model (Reeves et al. 2008), which uses a grid of XSTAR absorption models (Kallman & Bautista 2001). We fix the setting of the ionised absorption values to those derived by Ricci et al. (2017). Following Ricci et al. (2017) (and since we are primarily interested on the spectral cut-off), we chose, for simplicity, to model the Fe line emission only using a narrow component. Then our modelling of the Fe emission relies on the PEXMON model and we do not add a broad Fe line component. Finally, a constant multiplication factor, varying within 3% between FMP instruments, has also been included to account for calibration issues. In XSPEC notation, our model is described as: ZPHABS*ZXIPCF*PEXMON. The inclination angle of the reflecting slab has been frozen to 60 degrees. The photon index (Γ), the relative reflection strength (R), the high energy cutoff (Ec), and the normalisation parameters are free to vary. We use χ2 statistics for the goodness of the fit and the error estimation.
In Fig. 3, we show the distribution of the reduced χ2 (χ2 over degrees of freedom) for all our spectra. In order to demonstrate the excellent quality of the photon statistics, we present the spectrum of the source NGC931 in Fig. 4 as an example.
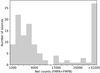 |
Fig. 2. Background-subtracted count distribution of our observations from the combined FPMA and FPMB instruments. The minimum number of counts is 550 and the maximum number is 697782 counts. |
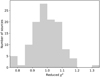 |
Fig. 3. Reduced χ2 (χ2 over degrees of freedom) for all sources. |
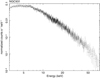 |
Fig. 4. Spectrum of the source NGC931. |
4. Results
In Table A.2, we present all the spectral fitting results for each source and the corresponding BAT ObsID, in increasing order, to facilitate direct comparison with the information listed in Table A.1. All the errors in the spectral components correspond to the 90% confidence interval. The estimated flux and luminosity are also presented for both the soft (2–10 keV) and the hard (20–40 keV) bands.
4.1. Absorption
Although we omitted from our sample all sources with a column density of NH > 1022 cm−2 as estimated in Ricci et al. (2017), our spectral fitting revealed four sources that present significant absorption (> 5 × 1022 cm−2) in the NuSTAR spectra. These are the sources with BAT obsID 449, 765, 912, and 976. As all these appear unobscured in the Ricci et al. (2017) analysis, this suggests significant variability in the obscuring screen. At least for the case of Mrk704, such evidence has already been presented in, for instance, Matt et al. (2011). Following our selection criteria, as discussed in Sect. 2, we excluded these four sources from further analyses, leaving 118 sources in our sample.
4.2. Photon index
The photon index has been accurately measured for all 118 sources with no upper or lower limit measurements. The normalised distribution is presented in Fig. 5. The median (mean) value of the photon index distribution is 1.77 (1.78). The upper and lower quartiles are 0.13 and 0.14, respectively. We can approximate the 90% error of the median (mean) by using the relations 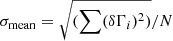 and σmedian = k × σmean. The scaling factor, k, equals 1.253 assuming a Gaussian distribution and δΓi, namely, the individual errors in the photon index, can be approximated by the average value of upper and lower limit uncertainties. Then the corresponding median (mean) error is σ = 0.013 (0.010).
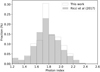 |
Fig. 5. Distribution of the photon indices (open histogram). The gray histogram shows the estimates from Ricci et al. (2017). The distributions are normalised to facilitate the comparison. |
Ricci et al. (2017) presented the broadband X-ray characteristics of the 70-month Swift/BAT all-sky survey by combining BAT AGN spectra with deeper soft X-ray observations. Their best-fitting photon indices for non-blazar AGNs with NH < 1022 cm−2 have also been plotted for comparison in Fig. 5. They find a median Γ = 1.80 ± 0.02. Both the median value and the full distribution are in excellent agreement with our findings.
4.3. Reflection parameter
The reflection parameter, R, has been securely inferred (no censored values) for 106 out of 118 sources. For 12 sources (∼13% of the sample), only the upper limits could be obtained for R. In these cases, the R value in Table A.2 corresponds to the 90% upper limit.
In Fig. 6, we plot the distribution of the reflection parameter for the 106 sources. The median (mean) value is 0.71 (0.66). The first and third quartiles are 0.49 and 0.91, respectively. Using the same assumptions as in the case of the photon index, the error on the median (mean) value is σ = 0.06 (0.05). Next, we derive the reflection parameter, taking all 118 sources into account, that is, including the lower limits. We use the survival analysis ASURV software package (Isobe et al. 1986).
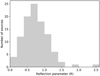 |
Fig. 6. Distribution of the reflection parameter R for the 106 sources in our sample. |
The derived corrected mean value from ASURV is R = 0.69 ± 0.04. Ricci et al. (2017) obtain a median R value of 0.83±0.14, taking into account all measurements for their NH < 1022 cm−2 sample. This is in reasonable agreement with our estimates. However, the present NuSTAR results offer a substantial qualitative improvement over the previous BAT results. This is because there is a significant fraction of lower limits in Ricci et al. (2017), whereas in our sample, it is very low (13%).
4.4. High-energy cut-off
The high energy cut-off parameter, Ec, has been securely measured for 62 sources (53% of sample). For the remaining 56 sources, we provide the 90% lower limit. The highest Ec value of  keV measured for NGC1566 demonstrates the ability of NuSTAR to constrain even some highest energy cut-offs. NGC4051 possibly represents another case of a cut-off at very high energies. Despite the lower-limit Ec estimate for NGC4051, the results suggest a high energy cut-off greater than ∼700 keV at a 90% confidence. Given the excellent quality of the spectrum, presenting more than 200 000 net counts, this suggests an extremely high value for Ec that is similar, for example, to the Seyfert 2 NGC5506 (Matt et al. 2015).
In Fig. 7, we plot the distribution of the high energy cut-off for the 62 sources with securely inferred spectral cut-offs. The median (mean) value is 89 (102) keV. The first and third quartiles are 65 keV and 102 keV, respectively. Using the same assumptions as in the case of the photon index and R the approximated error on the median (mean) value is σ = 20 (16) keV. We note that Ricci et al. (2017) find a median value 80 keV for their securely inferred Ec measurements, which is fully compatible with our result. Since for a large fraction of our sources in our sample (∼50%) only lower limits on the high energy cut-off are available, the values reported above are not representative of the whole sample of Swift/BAT AGN. Therefore, we used the Kaplan-Meier estimator (Isobe et al. 1986) to take the upper and lower limits into account. We find a mean value of 206 ± 38 keV. We can compare this with the results from Ricci et al. (2017), who quote a mean value of 331 ± 29 keV. The striking difference of the results is possibly related to the substantial fraction of censored values in the sample of Ricci et al. (2017) (i.e. > 70%).
 |
Fig. 7. Grey histogram: Observed distribution of the high energy spectral cut-off for the 62 sources, with securely inferred values. White histogram: Same population with the grey histogram after taking into account the uncertainties in each individual measurement of the Ec parameter using MCMC simulations. |
Nevertheless, Fig. 7 suggests that the Ec distribution is right-skewed. Moreover, the inspection of the individual errors of the Ec parameter (listed in Table A.2) also reveal the presence of large and asymmetric errors for a significant fraction of the sample. Therefore, the error estimation on the high energy cut-off presented should be treated with caution. Instead, we chose to estimate the probability distribution of the cut-off values. We adopted a Markov chain Monte Carlo (MCMC) method in XSPEC, using the Goodman-Wearer algorithm, to derive the distribution of the Ec parameter for each accurately measured value. Then we calculated the average probability distribution of the actually measured high energy cut-offs by summing all the MCMC results of the individual sources.
In Fig. 7 we present the average probability distribution of the Ec parameter for the detections after taking into account the correct error distribution for each source using the MCMC simulation approach. The corrected distribution is slightly shifted to the right due to the uncertainties towards higher energies. The mean value of the observed Ec parameter (based on the MCMCs presented in Fig. 7) is 150 keV. The mean values of all spectral parameters are summarised in Table 1.
Mean values for the spectral parameters.
5. Simulations for the estimation of the true Ec distribution
The high number of upper limits in the spectral cut-off may cast some doubt on the validity of the values quoted above. The high number of upper limits can be partially attributed to the relatively limited bandwidth of the X-ray observations. We note that the value of the median (mean) cut-off is outside the NuSTAR spectral energy band-pass. In principle, the use of the survival analysis techniques alleviates this problem. However, an inherent assumption is that the upper limits originate from the same parent population with the values that have actually been constrained. For example, if there is a population with much higher coronal temperatures (cut-offs), or if our analysis systematically identifies only the low cut-off sources, this will not be reflected in our results.
Moreover, a degeneracy between the photon index and the high-energy cut-off in the spectral model employed may affect the spectral fitting results (e.g., Tortosa et al. 2018). This degeneracy demonstrates the fact that an underestimated value of the Ec parameter can be compensated, in terms of the goodness of fit, by a flatter photon index. Furthermore, imperfect modelling of the soft part of the X-ray spectrum may also induce correlations between the photon index and the high energy cut-off, particularly when observations from different instruments are combined (Molina et al. 2019) or, alternatively, when significant absorption is expected in the X-ray spectra (Baloković et al. 2020).
In order to determine the properties of the parent population, we employed detailed simulations that take into account all the possible observational degeneracies and systematics.
5.1. Description of the simulation methodology
Our idea is to simulate a number of spectral data sets with identical characteristics to those found for our sample, using however, each time, a different distribution only for the spectral cut-off Ec parameter. Then we repeated the same spectral analysis (presented in Sect. 3.2) to derive different output distributions for the high energy cut-off parameter. The goal is to identify the output Ec distribution that best matches our observed sample distribution. Then the true distribution of our population would be the known, real distribution that corresponds to the best matched simulated sample.
We assume a skewed (Maxwell-Boltzmann) probability distribution for the spectral cut-off parameter:
 (1)
(1)
This choice is motivated by the shape of the Ec distribution in Fig. 7. The distribution does not introduce unrealistic negative Ec values as would be the case if a Gaussian form was used. Moreover, this distribution presents the advantage that its shape is determined by only one parameter, the distribution parameter α, thus significantly reducing the number of the performed simulations. The distribution parameter α defines its mean value through the relation  .
.
We also assume that the true distributions of the photon index and the reflection strength of our sample follow the derived observed distributions (see Figs. 5 and 6 respectively). This implicitly assumes that the spectral fitting does not affect the intrinsic distribution of the Γ and R parameters.
We simulated 14 samples, assuming a different Ec distribution with the value of the distribution parameter α ranging from 25 keV–500 keV. Each sample contains ten times more sources than our sample. Spectra and background files are created using XSPEC with the same count as well as Γ and R distributions with our sample. We fit the simulated data in each sample and tried to measure the Γ, R, and Ec parameters as well as their uncertainties at the 90% confidence level in order to make a comparison with the observations.
5.2. Simulation results and comparisons with the data
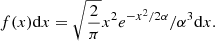
In all the simulations we conducted, the photon index has been accurately constrained in 100% of the spectral fits regardless of the assumed Ec distribution. The output distribution of the photon index closely reproduces the input distribution in all cases. An example is presented in Fig. 8, where we plot the input and output Γ distributions for the simulated samples with an α parameter of 175 keV. The Kolmogorov-Smirnov test of the two distributions gives a probability of ∼0.80, supporting the hypothesis that the two distributions are equivalent.
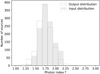 |
Fig. 8. Example of the comparison between the input and the output distributions of the photon index for a simulated sample with an α parameter of 175 keV. |
Similarly, the output distribution of the reflection parameter closely follows the input distribution. In Fig. 9, we compare the input reflection’s parameter distribution and that of the output, that is, after the spectral fitting, for the same simulated sample presented above. Again, there is a reasonable agreement suggesting that the observed R distribution represents the true R distribution of the sample. The Kolmogorov-Smirnov statistical comparison gives a probability of ∼0.35, absolutely consistent with our hypothesis. We note that both the Γ and R distributions remain largely unaffected by the choice of the Ec parameter.
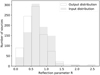 |
Fig. 9. Example of the comparison between the input and the output distributions of the reflection parameter for a simulated sample with an α parameter of 175 keV. |
On the other hand, the simulations reveal quite a different behaviour for the Ec parameter distribution. In Fig. 10, we compare the input (true) and the output (measured) distribution of the high-energy cut-off, for the simulated samples, for an α parameter of 25, 50, 100, 150, 200, and 300 keV. Clearly, as we move towards higher α values the difference between the measured and the true distribution increases drastically. This behaviour is quantified in Fig. 11, where we plot the mean value of the input (true) distribution of Ec versus the mean value of the output (measured) distribution of Ec. We observe that when the mean Ec lies well within the NuSTAR pass-band, (i.e. significantly smaller than 80 keV) the output (measured) distribution is similar to the input (true) one. This is reasonable since in this case the data can provide reliable constraints on the spectral cut-off. As we move to higher mean energies, outside the NuSTAR pass-band, the input and the output mean Ec values diverge significantly.
 |
Fig. 10. Comparison between the input and the output distributions of the high-energy cut-off parameter for a six simulated sample with an α parameter of 25, 50, 100, 150, 200, and 300 keV. |
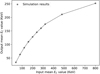 |
Fig. 11. Mean value of the spectral cut-off Ec of the input distribution of Ec versus the output distribution. |
In Fig. 12, we plot the expected fraction of Ec detections (at the 90% confidence interval) versus the α parameter that characterises the input Ec distribution. The horizontal lines show the measured fraction of Ec detections in our sample (solid line) and its 90% uncertainty level (dashed lines). We see that the acceptable α solution should be found within 75 keV and 165 keV with the most probable value being at 125 keV. These results correspond to a true mean value for the Ec parameter of 200 ± 60 keV. For values outside this range, the observed fraction of sources with well measured Ec values (observational data) is inconsistent with the corresponding fraction obtained from the simulations. Furthermore, from Fig. 12, we can see that the fraction of securely inferred Ec values decreases with increasing Ec. This is also a reasonable result implying that higher Ec values are more difficult to be accurately measured in a given X-ray spectrum.
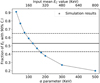 |
Fig. 12. Fraction of sources with Ec securely inferred values (not censored) as a function of the value of the α parameter. The solid horizontal line defines the fraction of Ec securely inferred measurements (no censored values), while the horizontal dashed lines denote the 90% uncertainty level. |
More stringent constraints can be placed through the comparison of the observed distribution presented in Fig. 7 with the normalised output distributions derived from the spectral fitting of the simulated samples (output distributions presented in Fig. 10). In Fig. 13 we compare our observed probability distribution with six different (output) distributions obtained from the simulations. These distributions correspond to an α parameter of 50, 75, 100, 125, 150, and 175 keV. A Kolmogorov-Smirnov test rejects the hypothesis that the distributions are the same for all but the α = 100 keV and α = 125 keV solutions. This suggests a true mean value for the Ec parameter of about 180 keV. This value is consistent, albeit somewhat lower, than that derived using the survival analysis (206 ± 38 keV). Our simulations are based on the assumption that the parent distribution follows a Maxwell Boltzmann distribution. However, the use of a similar symmetrical distribution could also provide acceptable results. For example, a Gaussian distribution with mean of 200 keV and sigma = 80 keV could also reproduce our observations; this is reasonable since this distribution is similar to a Maxwell-Boltzmann distribution with α = 125 keV.
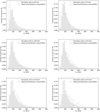 |
Fig. 13. Comparison between the observed distribution and the output distributions of the high energy cut-off parameter for a six different simulated samples with an α parameter of 50, 75, 100, 125, 150, and 175 keV. |
Combining this result with our estimates on the mean photon index and the mean high energy cut-off, we can estimate the mean properties of the corona for the Seyfert 1 population. Following Petrucci et al. (2001), the mean optical depth is approximately τe = 1.82 ± 0.14 and the mean temperature is approximately kTe = 65 ± 10 keV.
6. Summary and conclusions
We present an analysis of the NuSTAR spectra (3–80 keV) of a sample of 118 Seyfert 1 galaxies selected from the BAT all sky survey’s 105-month catalogue. This is the largest sample of Seyfert 1 galaxies with the NuSTAR spectra presented in the literature. Our main goal is to constrain the cut-off energy of the power-law spectrum and hence the temperature of the hot corona that produces the X-ray emission. Our results can be summarised as follows.
We find secure estimates for the spectral cut-off in 62 sources (53% of our sample), whereas for the remaining sources, only lower limits could be derived. The median (mean) value for the well constrained sources is 89 (103) keV, with the distribution being highly skewed towards higher energies; the 25 and 75% quartiles are 65 and 102 keV, respectively. As the exclusion of the lower limits introduces a bias in our sample towards the detection of the low energy spectral cut-offs, we estimated the spectral cut-off for the full sample using survival analysis techniques. The true mean value increases to 206 ± 38 keV. Furthermore, we check the validity of our results by performing extensive spectral simulations. This is important since the derived spectral cut-off lies outside the NuSTAR spectral pass-band (3–80 keV) and this could impede the accurate estimation of the spectral cut-off. Under the assumption of an underlying Maxwell-Boltzmann distribution, our simulations suggest that the spectral cut-off of the parent population is Ec ≈ 160 − 200 keV, which is significantly higher than that inferred from the actual observations. This result is comparable with the value derived using survival analysis techniques.
Our work also provides strong constraints on other spectral parameters. The mean value of the photon index is Γ = 1.78 ± 0.01. This is in good agreement with previous estimates of BAT-selected Seyfert 1 galaxy spectra which have been fitted using a combination of BAT and softer X-ray spectra from Chandra, XMM-Newton and Gehrels Swift/XRT. In addition, the reflection parameter derived from the full sample has a mean value of R = 0.69 ± 0.04. Again, this is in reasonable agreement with the previous BAT results on Seyfert 1 galaxies, but the excellent quality of the NuSTAR spectra significantly reduces the fraction of censored values, thus providing much more stringent constraints.
Combining these results, our work provides stringent constraints on the mean properties of the corona. The mean optical depth is approximately 1.82 ± 0.14 and the mean temperature is approximately 65 ± 10 keV.
Acknowledgments
We have made use of data from the NuSTAR mission, a project led by the California Institute of Technology, managed by the Jet Propulsion Laboratory, and funded by the National Aeronautics and Space Administration. We thank the NuSTAR Operations, Software and Calibration teams for support with the execution and analysis of these observations. This research has made use of the NuSTAR Data Analysis Software (NuSTARDAS) jointly developed by the Space Science Data Center (SSDC; ASI, Italy) and the California Institute of Technology (USA). This work is based on archival data, software or online services provided by the SSDC. This research has made use of the High Energy Astrophysics Science Archive Research Center Online Service, provided by the NASA/Goddard Space Flight Center and NASA’s Astrophysics Data System.
References
- Arnaud, K. A. 1996, in Astronomical Data Analysis Software and Systems V, eds. G. H. Jacoby, & J. Barnes, ASP Conf. Ser., 101, 17 [NASA ADS] [Google Scholar]
- Baloković, M., Harrison, F. A., Madejski, G., et al. 2020, ApJ, 905, 41 [Google Scholar]
- Barthelmy, S. D. 2004, in X-Ray and Gamma-Ray Instrumentation for Astronomy XIII, eds. K. A. Flanagan, & O. H. W. Siegmund, SPIE Conf. Ser., 5165, 175 [NASA ADS] [CrossRef] [Google Scholar]
- Baumgartner, W. H., Tueller, J., Markwardt, C. B., et al. 2013, ApJS, 207, 19 [Google Scholar]
- Brandt, W. N., & Alexander, D. M. 2015, A&ARv, 23, 1 [Google Scholar]
- Chartas, G., Rhea, C., Kochanek, C., et al. 2016, Astron. Nachr., 337, 356 [NASA ADS] [CrossRef] [Google Scholar]
- Dadina, M. 2007, A&A, 461, 1209 [NASA ADS] [CrossRef] [EDP Sciences] [Google Scholar]
- Emmanoulopoulos, D., Papadakis, I. E., Dovčiak, M., & McHardy, I. M. 2014, MNRAS, 439, 3931 [NASA ADS] [CrossRef] [Google Scholar]
- Fabian, A. C., Lohfink, A., Kara, E., et al. 2015, MNRAS, 451, 4375 [Google Scholar]
- Gehrels, N., Chincarini, G., Giommi, P., et al. 2004, ApJ, 611, 1005 [Google Scholar]
- Guerras, E., Dai, X., Steele, S., et al. 2017, ApJ, 836, 206 [NASA ADS] [CrossRef] [Google Scholar]
- Haardt, F., & Maraschi, L. 1991, ApJ, 380, L51 [Google Scholar]
- Harrison, F. A., Craig, W. W., Christensen, F. E., et al. 2013, ApJ, 770, 103 [Google Scholar]
- Hinkle, J. T., & Mushotzky, R. 2021, MNRAS, 506, 4960 [NASA ADS] [CrossRef] [Google Scholar]
- Isobe, T., Feigelson, E. D., & Nelson, P. I. 1986, ApJ, 306, 490 [Google Scholar]
- Johnson, W. N., McNaron-Brown, K., Kurfess, J. D., et al. 1997, ApJ, 482, 173 [NASA ADS] [CrossRef] [Google Scholar]
- Kallman, T., & Bautista, M. 2001, ApJS, 133, 221 [Google Scholar]
- Kamraj, N., Harrison, F. A., Baloković, M., Lohfink, A., & Brightman, M. 2018, ApJ, 866, 124 [CrossRef] [Google Scholar]
- Kara, E., Alston, W. N., Fabian, A. C., et al. 2016, MNRAS, 462, 511 [NASA ADS] [CrossRef] [Google Scholar]
- Ludlam, R. M., Cackett, E. M., Gültekin, K., et al. 2015, MNRAS, 447, 2112 [NASA ADS] [CrossRef] [Google Scholar]
- Malizia, A., Molina, M., Bassani, L., et al. 2014, ApJ, 782, L25 [NASA ADS] [CrossRef] [Google Scholar]
- Matt, G., Bianchi, S., Guainazzi, M., et al. 2011, A&A, 533, A1 [NASA ADS] [CrossRef] [EDP Sciences] [Google Scholar]
- Matt, G., Baloković, M., Marinucci, A., et al. 2015, MNRAS, 447, 3029 [NASA ADS] [CrossRef] [Google Scholar]
- McHardy, I. M., Gunn, K. F., Uttley, P., & Goad, M. R. 2005, MNRAS, 359, 1469 [NASA ADS] [CrossRef] [Google Scholar]
- Molina, M., Malizia, A., Bassani, L., et al. 2019, MNRAS, 484, 2735 [CrossRef] [Google Scholar]
- Nandra, K., O’Neill, P., George, I., & Reeves, J. 2007, MNRAS, 382, [Google Scholar]
- Oh, K., Koss, M., Markwardt, C. B., et al. 2018, ApJS, 235, 4 [Google Scholar]
- Perri, M., Puccetti, S., Spagnuolo, N., et al. 2017, The NuSTAR Data Analysis Software Guide v1.9.3 [Google Scholar]
- Petrucci, P. O., Merloni, A., Fabian, A., Haardt, F., & Gallo, E. 2001, MNRAS, 328, 501 [Google Scholar]
- Rani, P., Stalin, C. S., & Goswami, K. D. 2019, MNRAS, 484, 5113 [NASA ADS] [CrossRef] [Google Scholar]
- Reeves, J., Done, C., Pounds, K., et al. 2008, MNRAS, 385, L108 [Google Scholar]
- Ricci, C., Trakhtenbrot, B., Koss, M. J., et al. 2017, ApJS, 233, 17 [Google Scholar]
- Tortosa, A., Bianchi, S., Marinucci, A., Matt, G., & Petrucci, P. O. 2018, A&A, 614, A37 [NASA ADS] [CrossRef] [EDP Sciences] [Google Scholar]
- Uttley, P., Cackett, E. M., Fabian, A. C., Kara, E., & Wilkins, D. R. 2014, A&ARv, 22, 72 [NASA ADS] [CrossRef] [Google Scholar]
- Vaiana, G. S., & Rosner, R. 1978, ARA&A, 16, 393 [NASA ADS] [CrossRef] [Google Scholar]
Appendix A: Additional tables
Log of the NuSTAR observations of Seyfert 1 galaxies.
Spectral fit results.
All Tables
All Figures
|
Fig. 1. Redshift distribution of the 122 sources in the final sample. |
| In the text | |
|
Fig. 2. Background-subtracted count distribution of our observations from the combined FPMA and FPMB instruments. The minimum number of counts is 550 and the maximum number is 697782 counts. |
| In the text | |
|
Fig. 3. Reduced χ2 (χ2 over degrees of freedom) for all sources. |
| In the text | |
|
Fig. 4. Spectrum of the source NGC931. |
| In the text | |
|
Fig. 5. Distribution of the photon indices (open histogram). The gray histogram shows the estimates from Ricci et al. (2017). The distributions are normalised to facilitate the comparison. |
| In the text | |
|
Fig. 6. Distribution of the reflection parameter R for the 106 sources in our sample. |
| In the text | |
|
Fig. 7. Grey histogram: Observed distribution of the high energy spectral cut-off for the 62 sources, with securely inferred values. White histogram: Same population with the grey histogram after taking into account the uncertainties in each individual measurement of the Ec parameter using MCMC simulations. |
| In the text | |
|
Fig. 8. Example of the comparison between the input and the output distributions of the photon index for a simulated sample with an α parameter of 175 keV. |
| In the text | |
|
Fig. 9. Example of the comparison between the input and the output distributions of the reflection parameter for a simulated sample with an α parameter of 175 keV. |
| In the text | |
|
Fig. 10. Comparison between the input and the output distributions of the high-energy cut-off parameter for a six simulated sample with an α parameter of 25, 50, 100, 150, 200, and 300 keV. |
| In the text | |
|
Fig. 11. Mean value of the spectral cut-off Ec of the input distribution of Ec versus the output distribution. |
| In the text | |
|
Fig. 12. Fraction of sources with Ec securely inferred values (not censored) as a function of the value of the α parameter. The solid horizontal line defines the fraction of Ec securely inferred measurements (no censored values), while the horizontal dashed lines denote the 90% uncertainty level. |
| In the text | |
|
Fig. 13. Comparison between the observed distribution and the output distributions of the high energy cut-off parameter for a six different simulated samples with an α parameter of 50, 75, 100, 125, 150, and 175 keV. |
| In the text | |
Current usage metrics show cumulative count of Article Views (full-text article views including HTML views, PDF and ePub downloads, according to the available data) and Abstracts Views on Vision4Press platform.
Data correspond to usage on the plateform after 2015. The current usage metrics is available 48-96 hours after online publication and is updated daily on week days.
Initial download of the metrics may take a while.