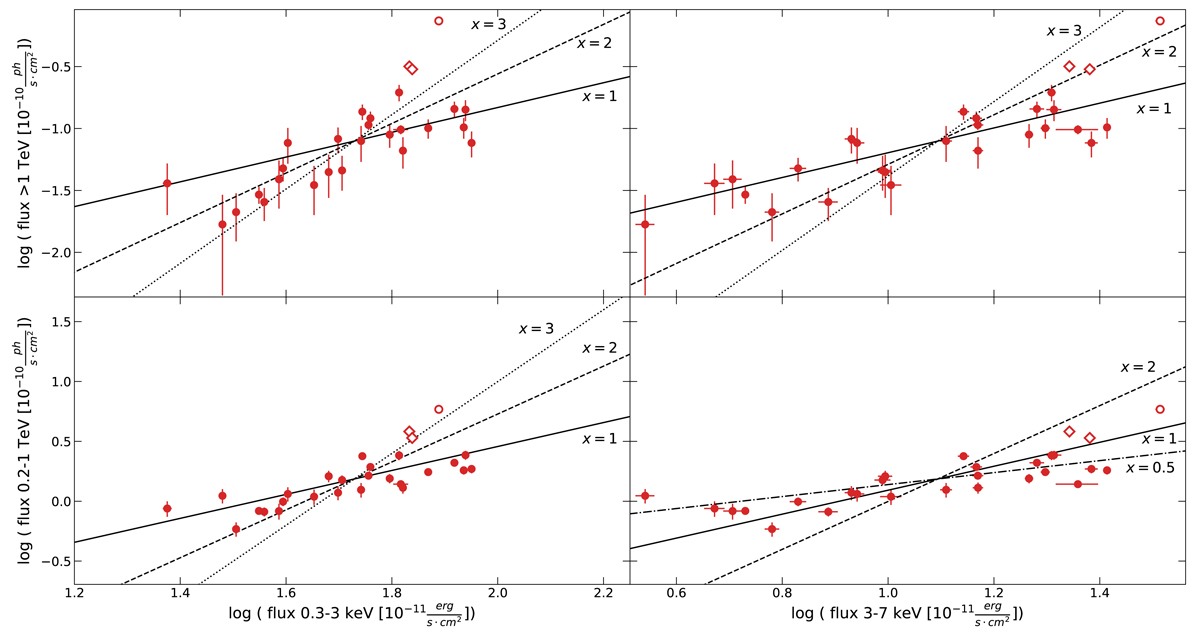
Fig. 9.
Download original image
VHE flux versus X-ray flux over the MWL campaign using MAGIC and Swift-XRT data. Data are nightly binned, and only pairs of measurement within 4 h are considered. MAGIC fluxes are in the > 1 TeV band (top panels) and in the 0.2–1 TeV band (lower panels). Swift-XRT fluxes are computed in the 0.3–3 keV (left panels) and 3–7 keV bands (right panels). The open red diamond markers highlight measurements on MJD 57757 and MJD 57785 (i.e., the dates of the first two simultaneous MAGIC/NuSTAR/Swift observations). The VHE flare (on MJD 57788) is plotted in open red circle marker. Black lines depict linear functions (in the log-log plane) with slopes x = 1, 2, 3. In the 0.2–1 TeV versus 3–7 keV panel, because of the dynamical range of the data, the linear function with slope x = 3 is replaced with one with slope of x = 0.5. The Pearson coefficients, DCFs and the slopes from linear fits in the log-log plane are shown in Table 1.
Current usage metrics show cumulative count of Article Views (full-text article views including HTML views, PDF and ePub downloads, according to the available data) and Abstracts Views on Vision4Press platform.
Data correspond to usage on the plateform after 2015. The current usage metrics is available 48-96 hours after online publication and is updated daily on week days.
Initial download of the metrics may take a while.