Fig. 8.
Download original image
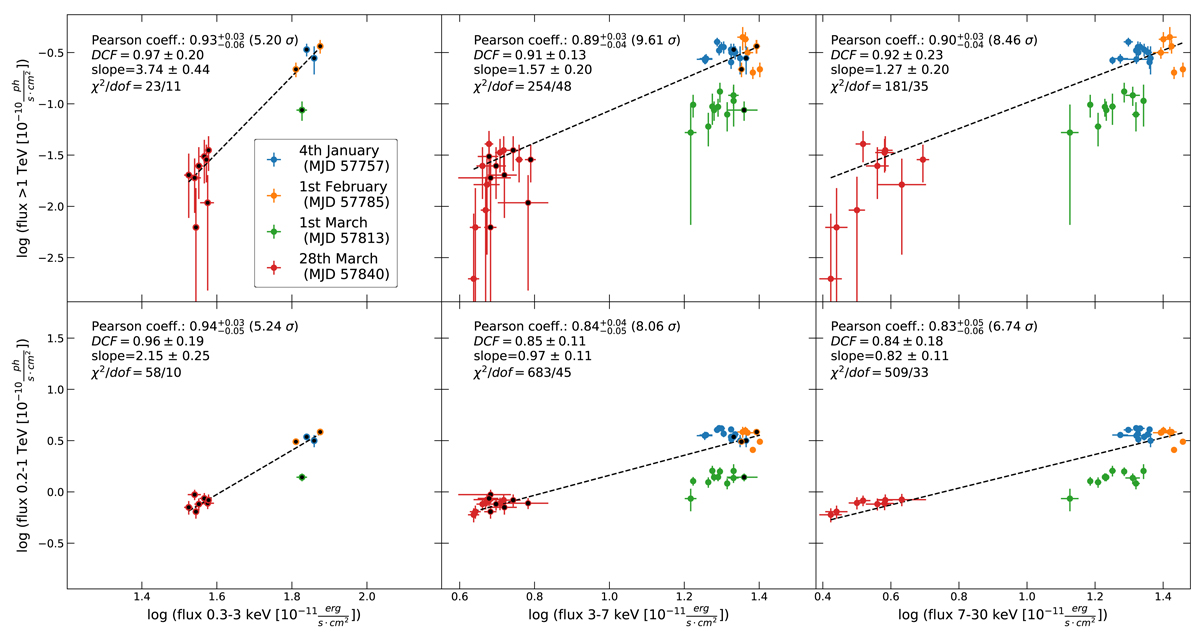
VHE flux versus X-ray flux during the simultaneous MAGIC/NuSTAR/Swift observations. Flux points are computed over time bins of 30 min. From left to right: the X-ray energy bands in the panels are 0.3–3 keV, 3–7 keV and 7–30 keV. In the upper panels, the MAGIC fluxes are in the > 1 TeV band, while in the lower panels they are in the 0.2–1 TeV band. Data points from Swift-XRT are shown with black-filled markers. Fluxes corresponding to each day are plotted in a different colour. The results of the Pearson coefficients (and its significance in σ), DCF and the slope of the linear fits in the log-log plane (with the χ2/d.o.f. values) are indicated in each of the corresponding subplots.
Current usage metrics show cumulative count of Article Views (full-text article views including HTML views, PDF and ePub downloads, according to the available data) and Abstracts Views on Vision4Press platform.
Data correspond to usage on the plateform after 2015. The current usage metrics is available 48-96 hours after online publication and is updated daily on week days.
Initial download of the metrics may take a while.