Fig. 6.
Download original image
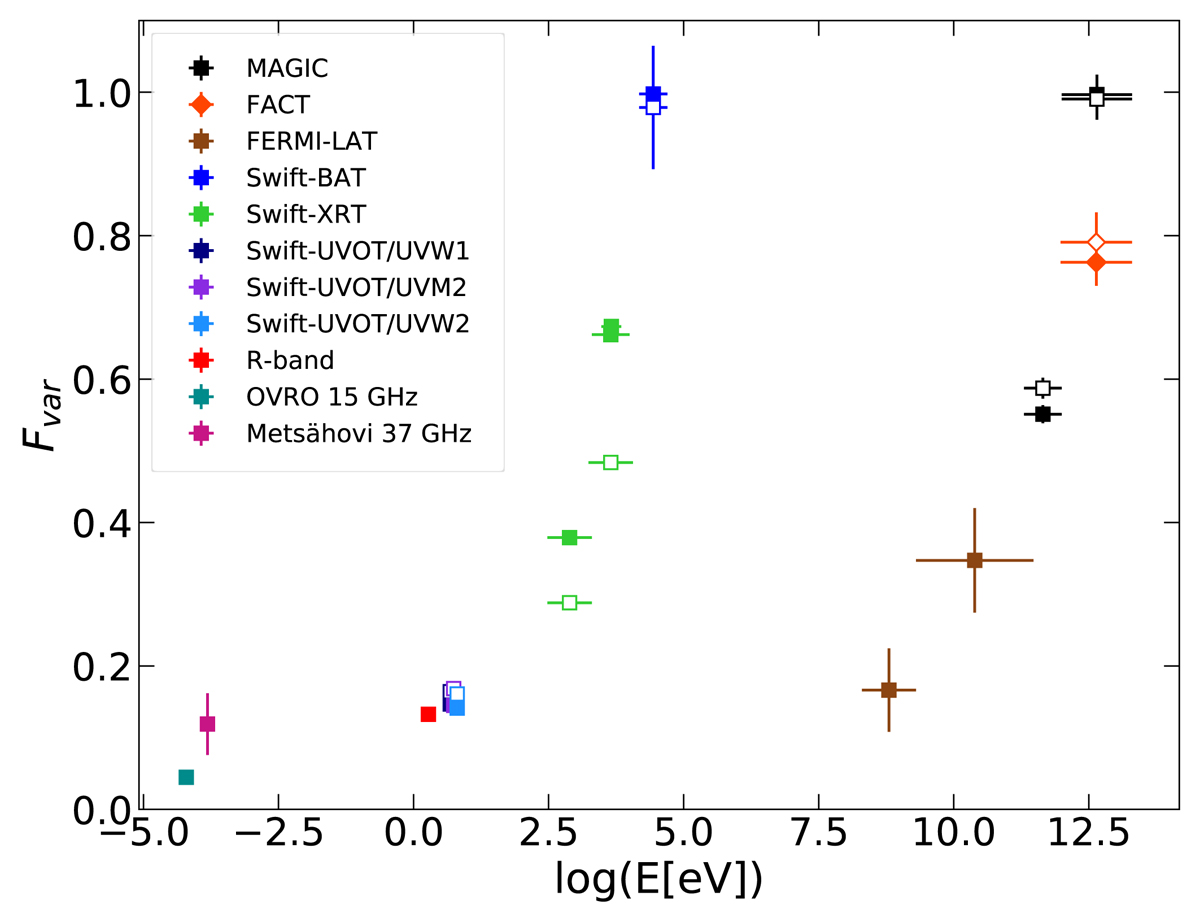
Fractional variability Fvar obtained from the light curves shown in Fig. 1. MAGIC, FACT, Swift-XRT, Swift-UVOT, R-band and radio fluxes are nightly binned. Fermi-LAT and Swift-BAT fluxes have a 3-day binning. Results from each instrument are plotted in different colours. The filled markers include all data. The hollow markers include VHE and Swift data lying within a time window of 4 h from each other.
Current usage metrics show cumulative count of Article Views (full-text article views including HTML views, PDF and ePub downloads, according to the available data) and Abstracts Views on Vision4Press platform.
Data correspond to usage on the plateform after 2015. The current usage metrics is available 48-96 hours after online publication and is updated daily on week days.
Initial download of the metrics may take a while.