Fig. 5.
Download original image
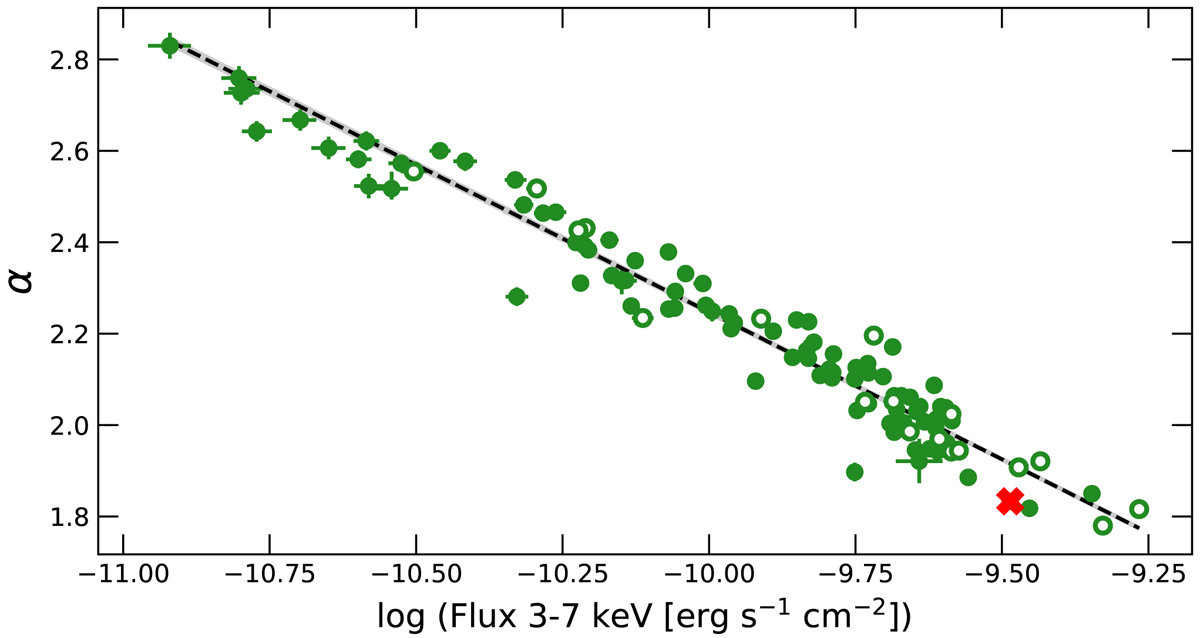
Log-parabola photon index α versus the 3–7 keV flux from the Swift-XRT observations. The log-parabolic fits are performed after fixing the spectral curvature β = 0.16. The red cross represents the flare on MJD 57788 seen at VHE energies. The black line represent a linear fit, while the grey area (hardly visible in the plot) is its uncertainty. The slope of α versus the 3–7 keV flux is −0.64 ± 0.01. Hollow markers depict fits with a p-value below 5 × 10⁻², which are not considered in the linear fit.
Current usage metrics show cumulative count of Article Views (full-text article views including HTML views, PDF and ePub downloads, according to the available data) and Abstracts Views on Vision4Press platform.
Data correspond to usage on the plateform after 2015. The current usage metrics is available 48-96 hours after online publication and is updated daily on week days.
Initial download of the metrics may take a while.