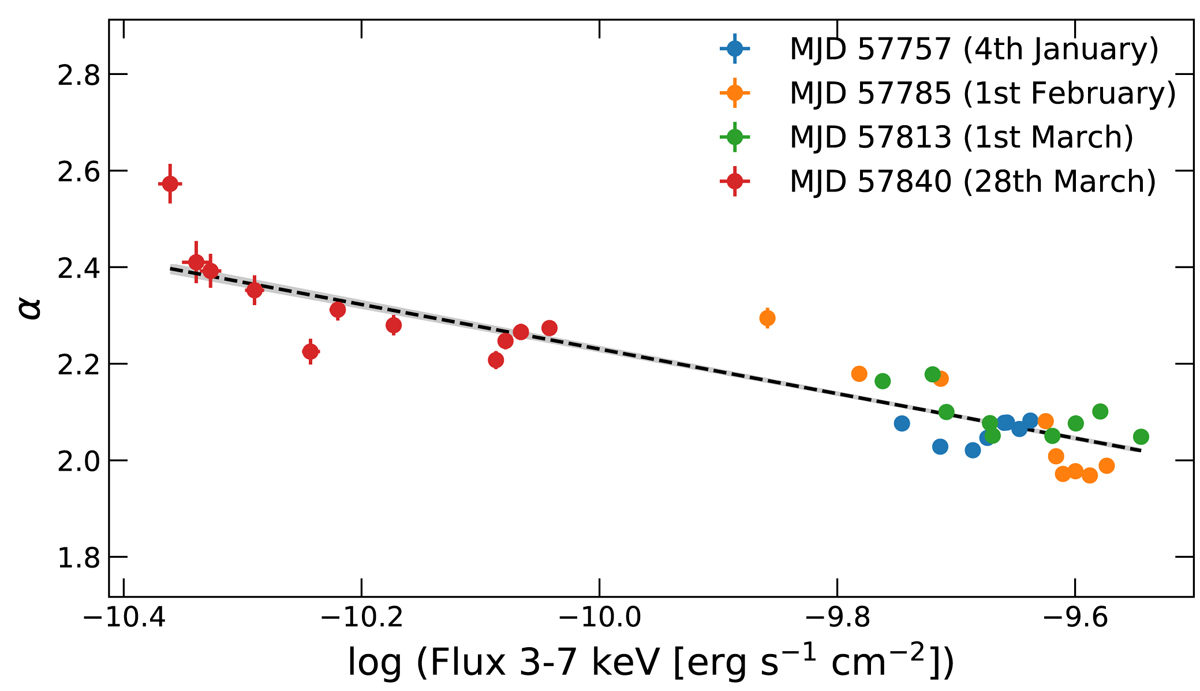
Fig. 4.
Download original image
Log-parabola photon index α versus the 3–7 keV flux of the orbit-wise NuSTAR observations. The parameter α is fitted after fixing spectral curvature β = 0.22 in the log-parabolic model. Each day is plotted with a different colour. The black line represents a linear fit, while the grey area is its uncertainty. The resulting slope is −0.46 ± 0.01.
Current usage metrics show cumulative count of Article Views (full-text article views including HTML views, PDF and ePub downloads, according to the available data) and Abstracts Views on Vision4Press platform.
Data correspond to usage on the plateform after 2015. The current usage metrics is available 48-96 hours after online publication and is updated daily on week days.
Initial download of the metrics may take a while.