Open Access
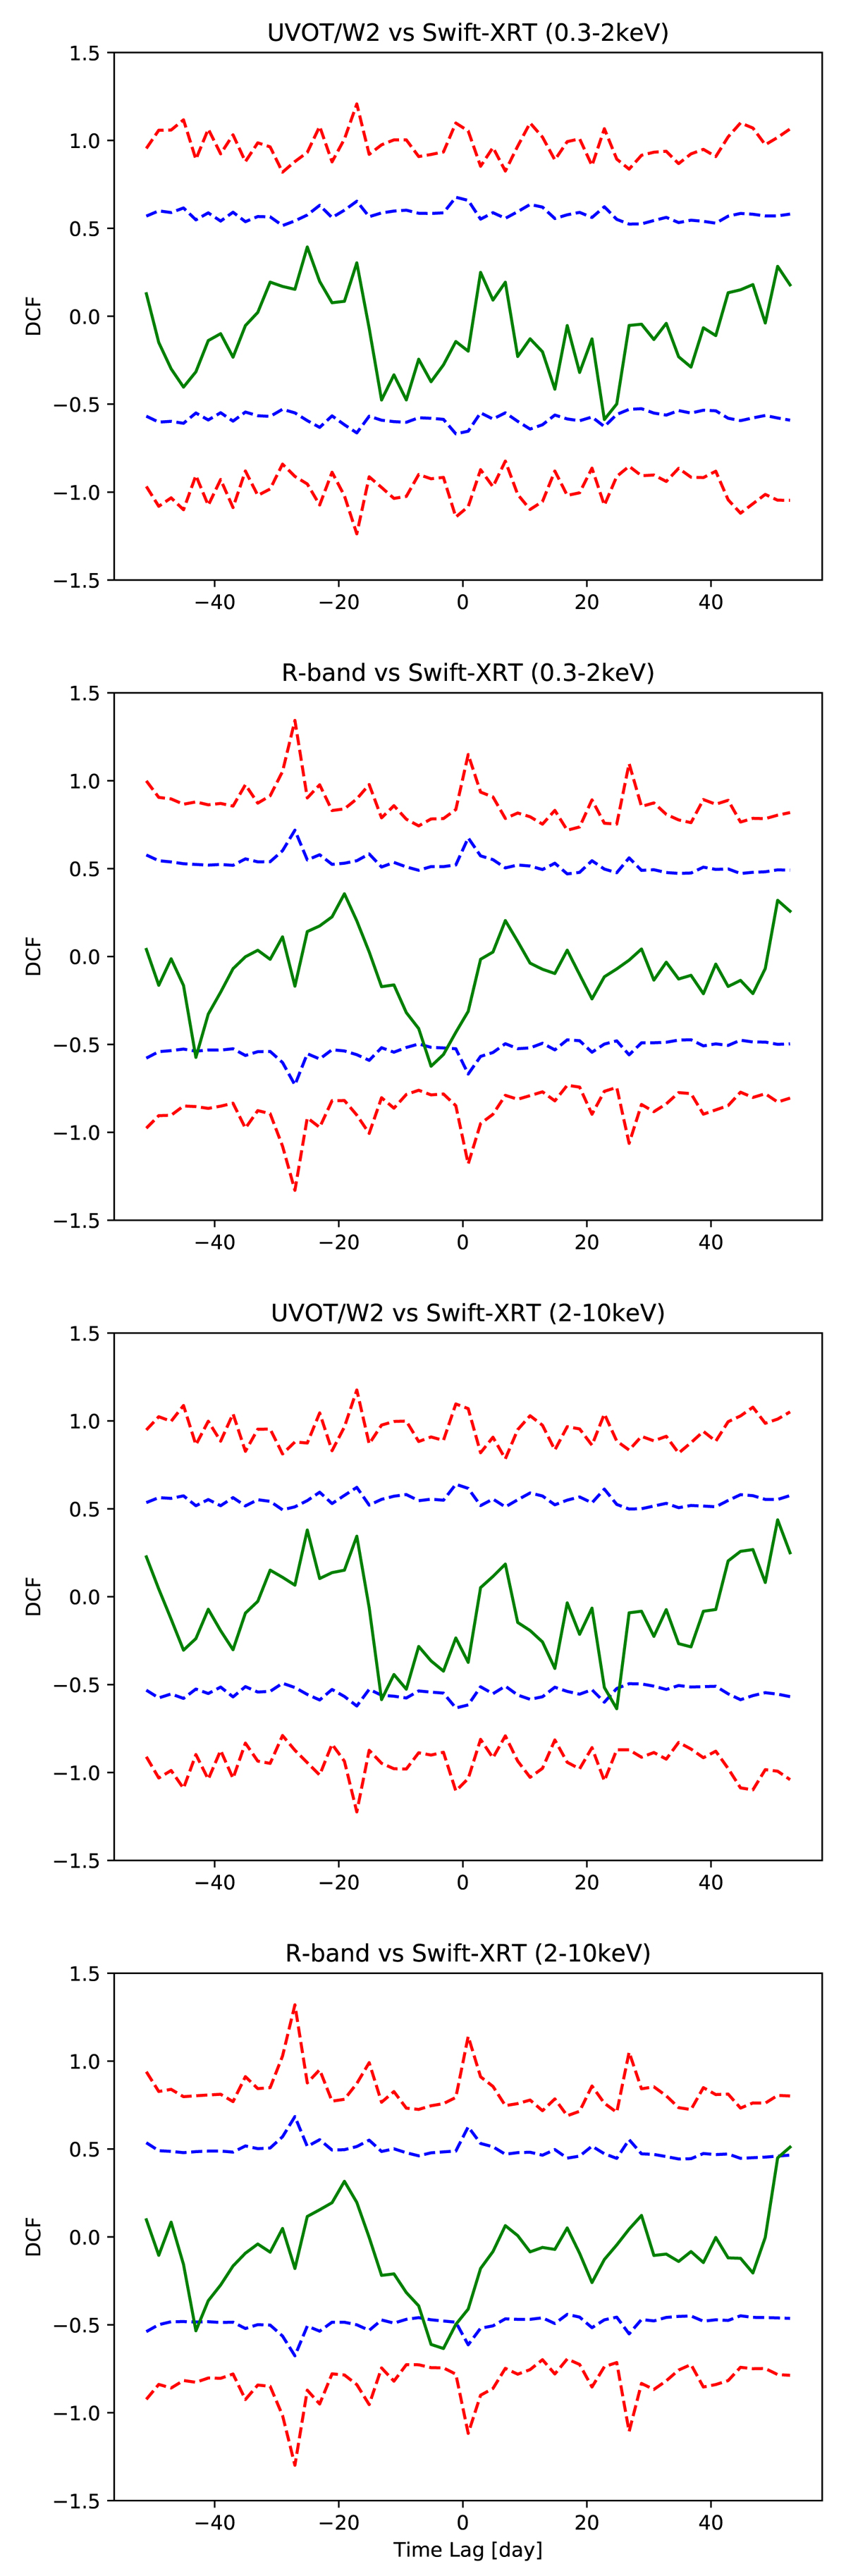
Fig. F.1.
Download original image
DCF between X-ray (0.3-2 keV and 2-10 keV) and UV-optical (Swift-UVW2 and R-band) when removing data before MJD 57760. The blue- and red-dashed-lines indicate the 2σ and 3σ confidence intervals estimated from the Monte Carlo simulations, as described in the text.
Current usage metrics show cumulative count of Article Views (full-text article views including HTML views, PDF and ePub downloads, according to the available data) and Abstracts Views on Vision4Press platform.
Data correspond to usage on the plateform after 2015. The current usage metrics is available 48-96 hours after online publication and is updated daily on week days.
Initial download of the metrics may take a while.