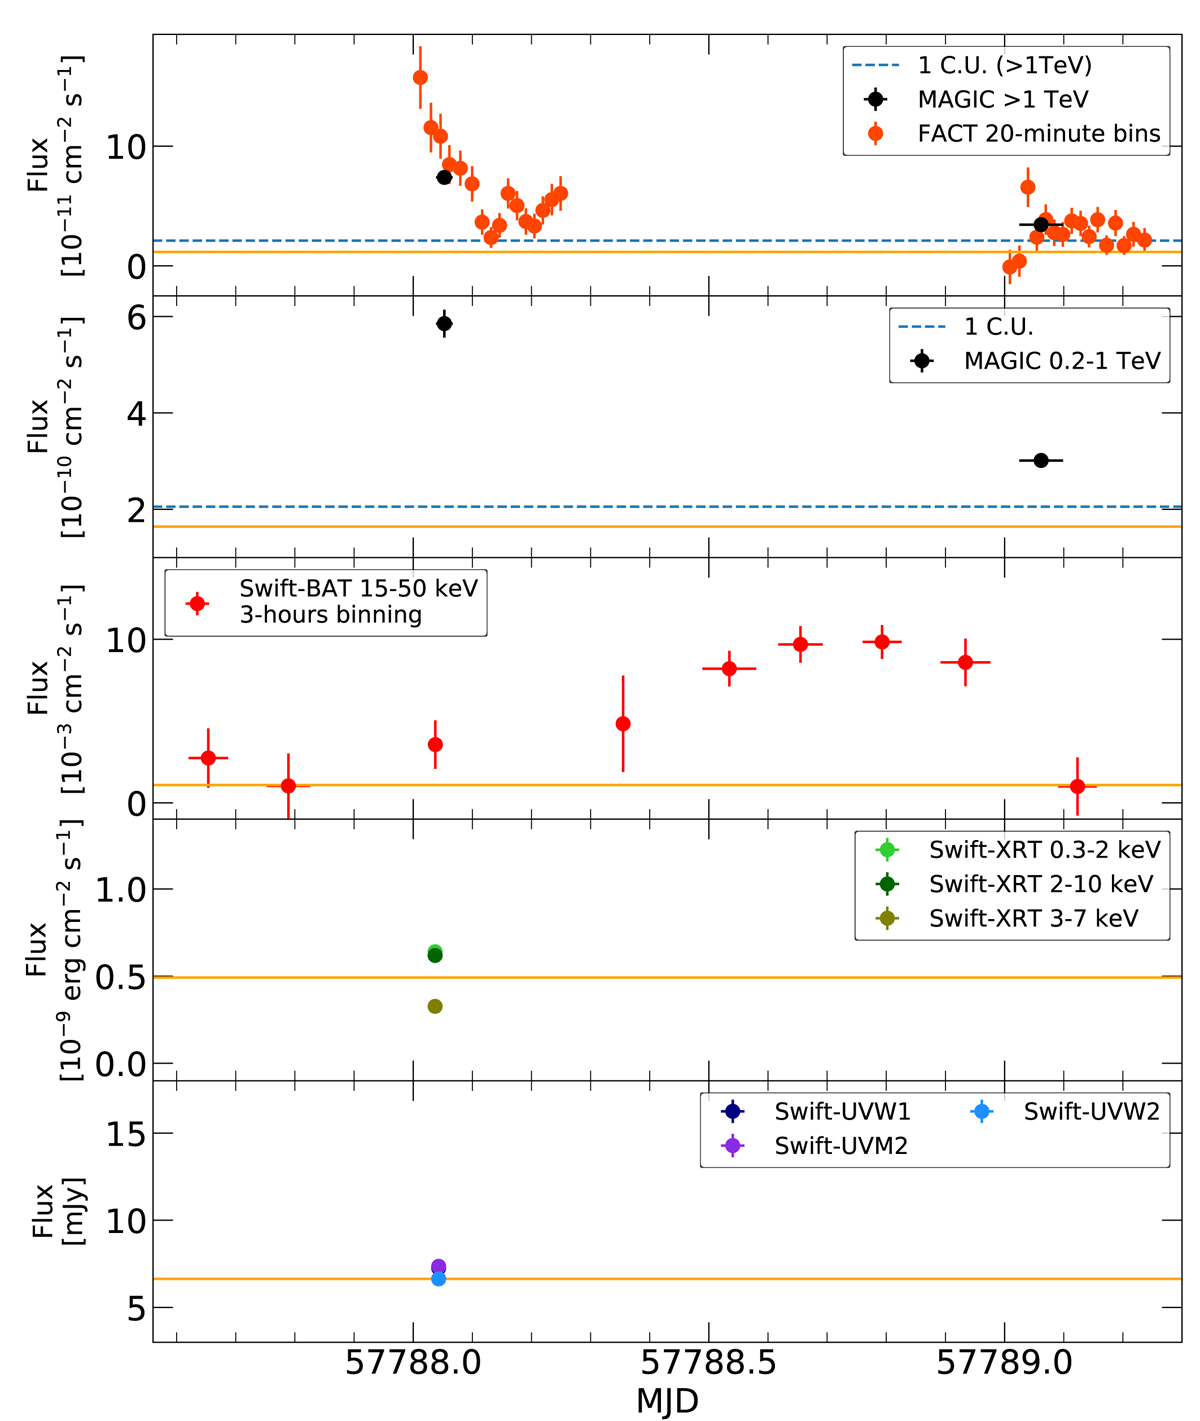
Fig. 2.
Download original image
Zoom on the MWL light curves around the VHE flare on MJD 57788. Two first panels from the top show the FACT (> 0.95 TeV) and the MAGIC (> 1 TeV & 0.2–1 TeV) light curves. The FACT fluxes are computed on 20-min binning while the MAGIC light curve is nightly averaged. On MJD 57788 and MJD 57789 the MAGIC exposures are ∼40 min and ∼100 min respectively, and are depicted with the width of the horizontal bars of the markers. Third panel from the top: the Swift-BAT light curve with 3-h binning. Two panels from the bottom: the Swift-XRT (0.3–2 keV & 3–7 keV & 2–10 keV) and Swift-UVW1/UVM2/UVW2 fluxes. The horizontal orange lines show the average flux over the entire campaign in each energy regime. Top panel: the orange line is the average from the MAGIC > 1 TeV light curve. In the two lowest panels, the orange line depicts the average in the Swift-XRT 0.3–2 keV and Swift-UVW2 bands.
Current usage metrics show cumulative count of Article Views (full-text article views including HTML views, PDF and ePub downloads, according to the available data) and Abstracts Views on Vision4Press platform.
Data correspond to usage on the plateform after 2015. The current usage metrics is available 48-96 hours after online publication and is updated daily on week days.
Initial download of the metrics may take a while.