Fig. C.1.
Download original image
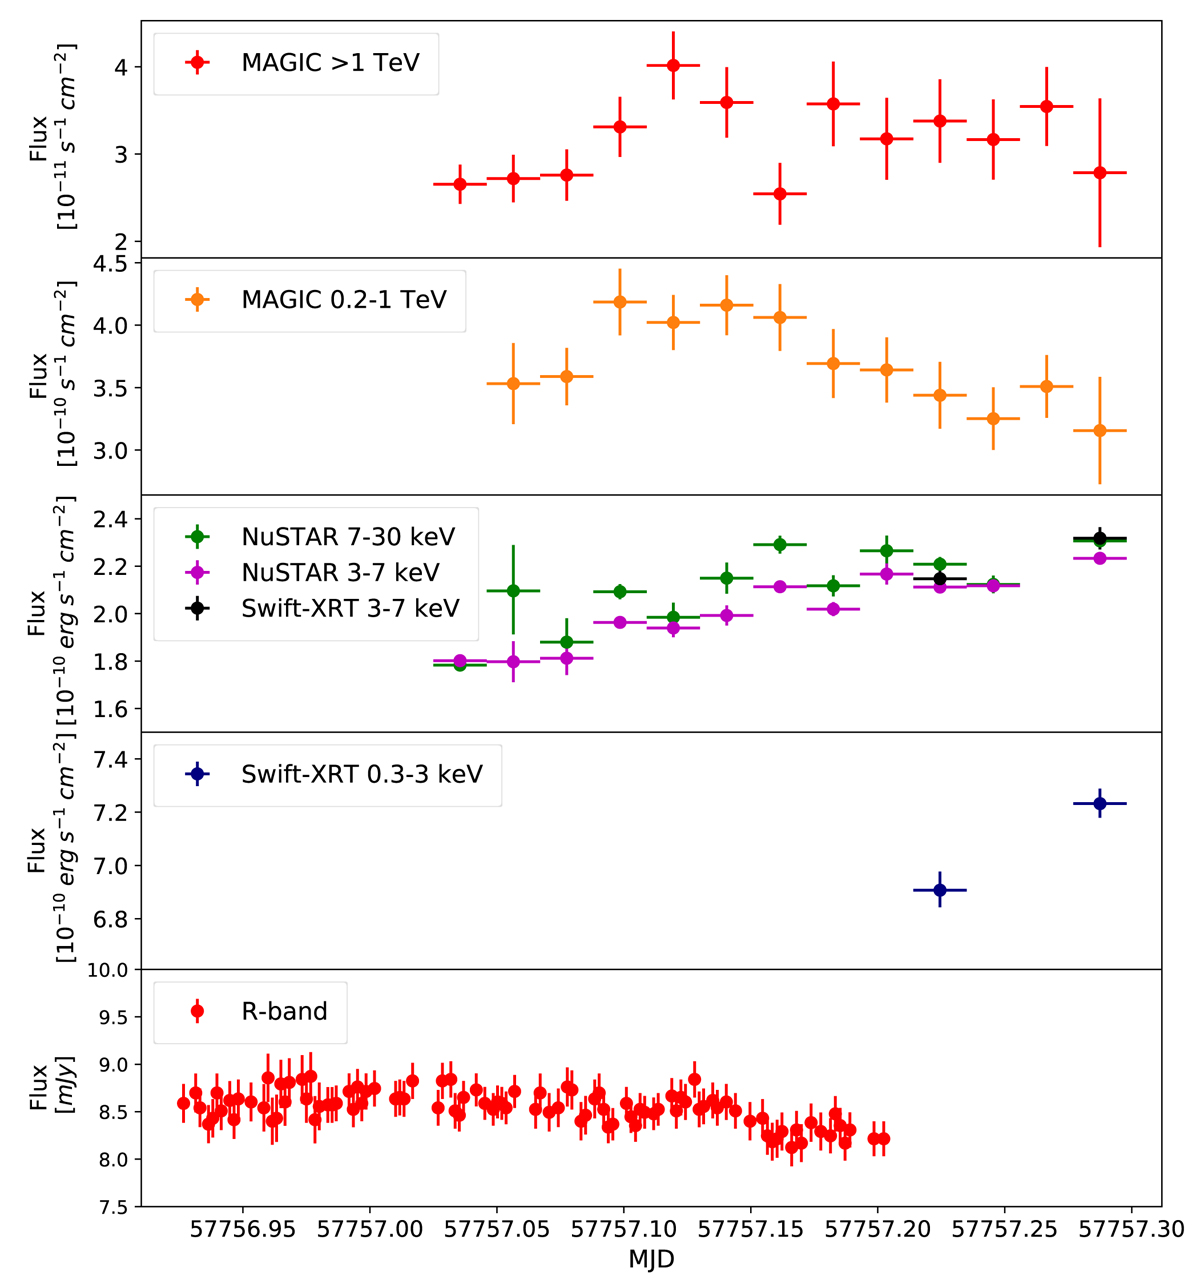
MWL light curves during the simultaneous MAGIC/NuSTAR/Swift observations on MJD 57757. The first two panels from the top are the MAGIC light curves in the 0.2-1 TeV and > 1 TeV bands with 30 min binning. The third and fourth panels from the top show the NuSTAR and Swift-XRT light curves in the 0.3-3 keV, 3-7 keV and 7-30 keV bands with 30-min binning. The bottom panel shows the R-band observations provided by the WEBT-GASP community.
Current usage metrics show cumulative count of Article Views (full-text article views including HTML views, PDF and ePub downloads, according to the available data) and Abstracts Views on Vision4Press platform.
Data correspond to usage on the plateform after 2015. The current usage metrics is available 48-96 hours after online publication and is updated daily on week days.
Initial download of the metrics may take a while.