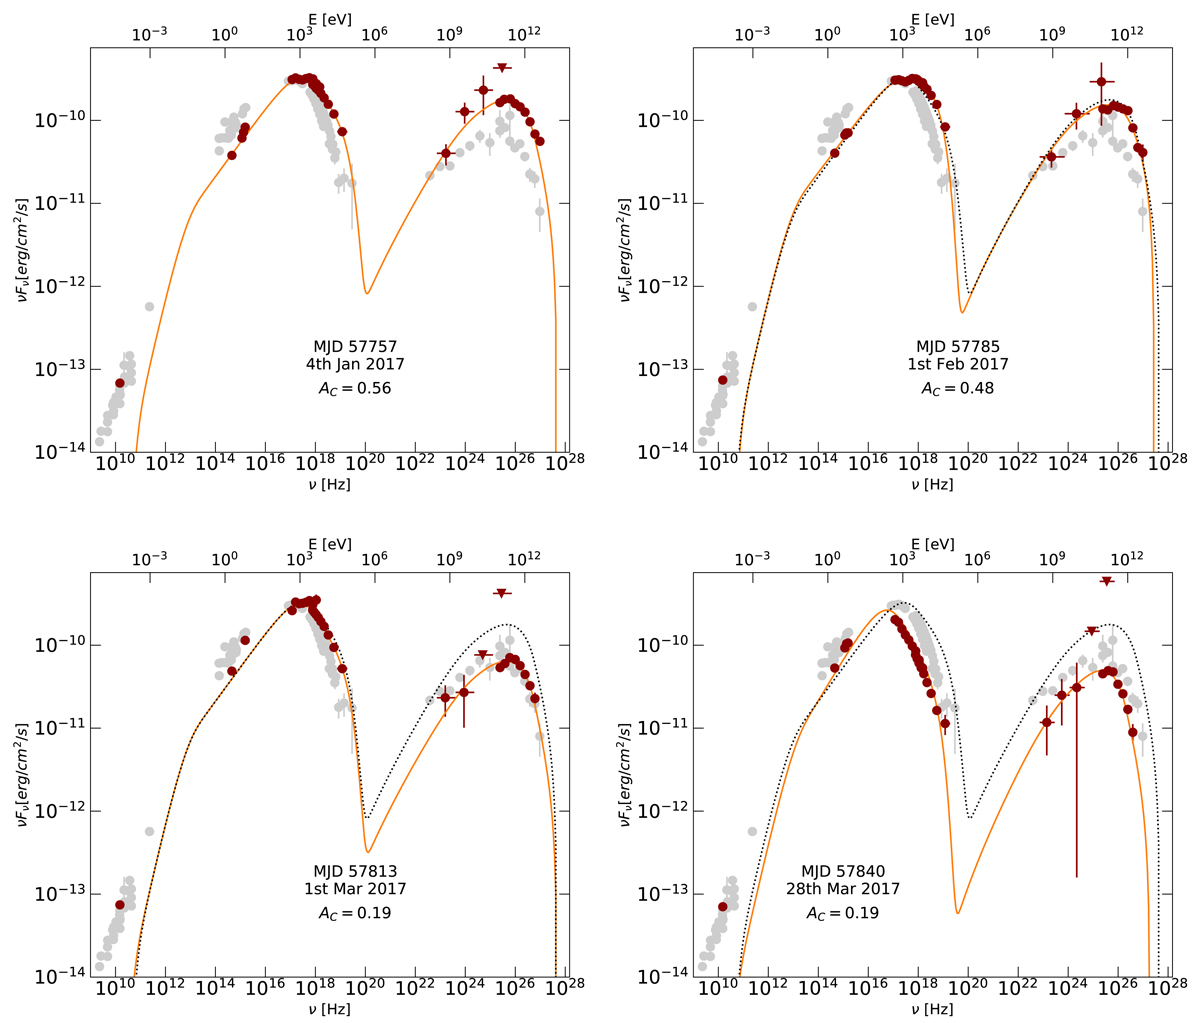
Fig. 15.
Download original image
SED of the four simultaneous MAGIC/NuSTAR/Swift observations (MJD 57757, MJD 57785, MJD 57813, MJD 57840). The data points and obtained one-zone SSC models are plotted with brown markers and orange lines, respectively. The parameters of the one-zone SSC models are shown in Table 5. For comparison purposes, the one-zone SSC model of the first pointing (MJD 57757) is plotted with black dotted lines in all the other subplots. The Compton dominance parameter AC determined from the model is indicated on each panel. Archival data representing the typical Mrk 421 state from Abdo et al. (2011) are shown in grey.
Current usage metrics show cumulative count of Article Views (full-text article views including HTML views, PDF and ePub downloads, according to the available data) and Abstracts Views on Vision4Press platform.
Data correspond to usage on the plateform after 2015. The current usage metrics is available 48-96 hours after online publication and is updated daily on week days.
Initial download of the metrics may take a while.