Fig. 11.
Download original image
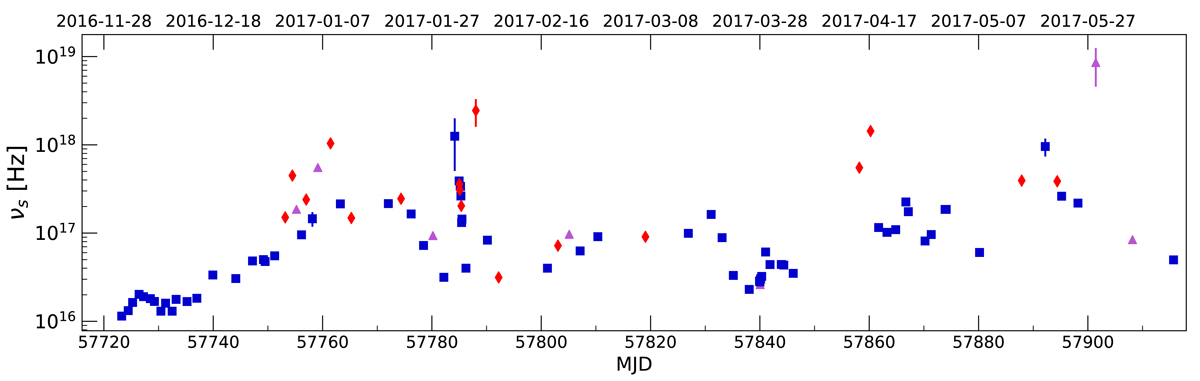
Evolution of the synchroton peak frequency νs versus time throughout the MWL campaign. The peak frequencies are obtained by fitting a log-parabola to simultaneous Swift-XRT, Swift-UVOT and Swift-BAT observations. Blue square markers indicate fits that result in a p-value above 10−3. Data points in violet triangles correspond to a p-value between 10−3 and 10−4, and red diamond markers have a p-value lower than 10−4.
Current usage metrics show cumulative count of Article Views (full-text article views including HTML views, PDF and ePub downloads, according to the available data) and Abstracts Views on Vision4Press platform.
Data correspond to usage on the plateform after 2015. The current usage metrics is available 48-96 hours after online publication and is updated daily on week days.
Initial download of the metrics may take a while.