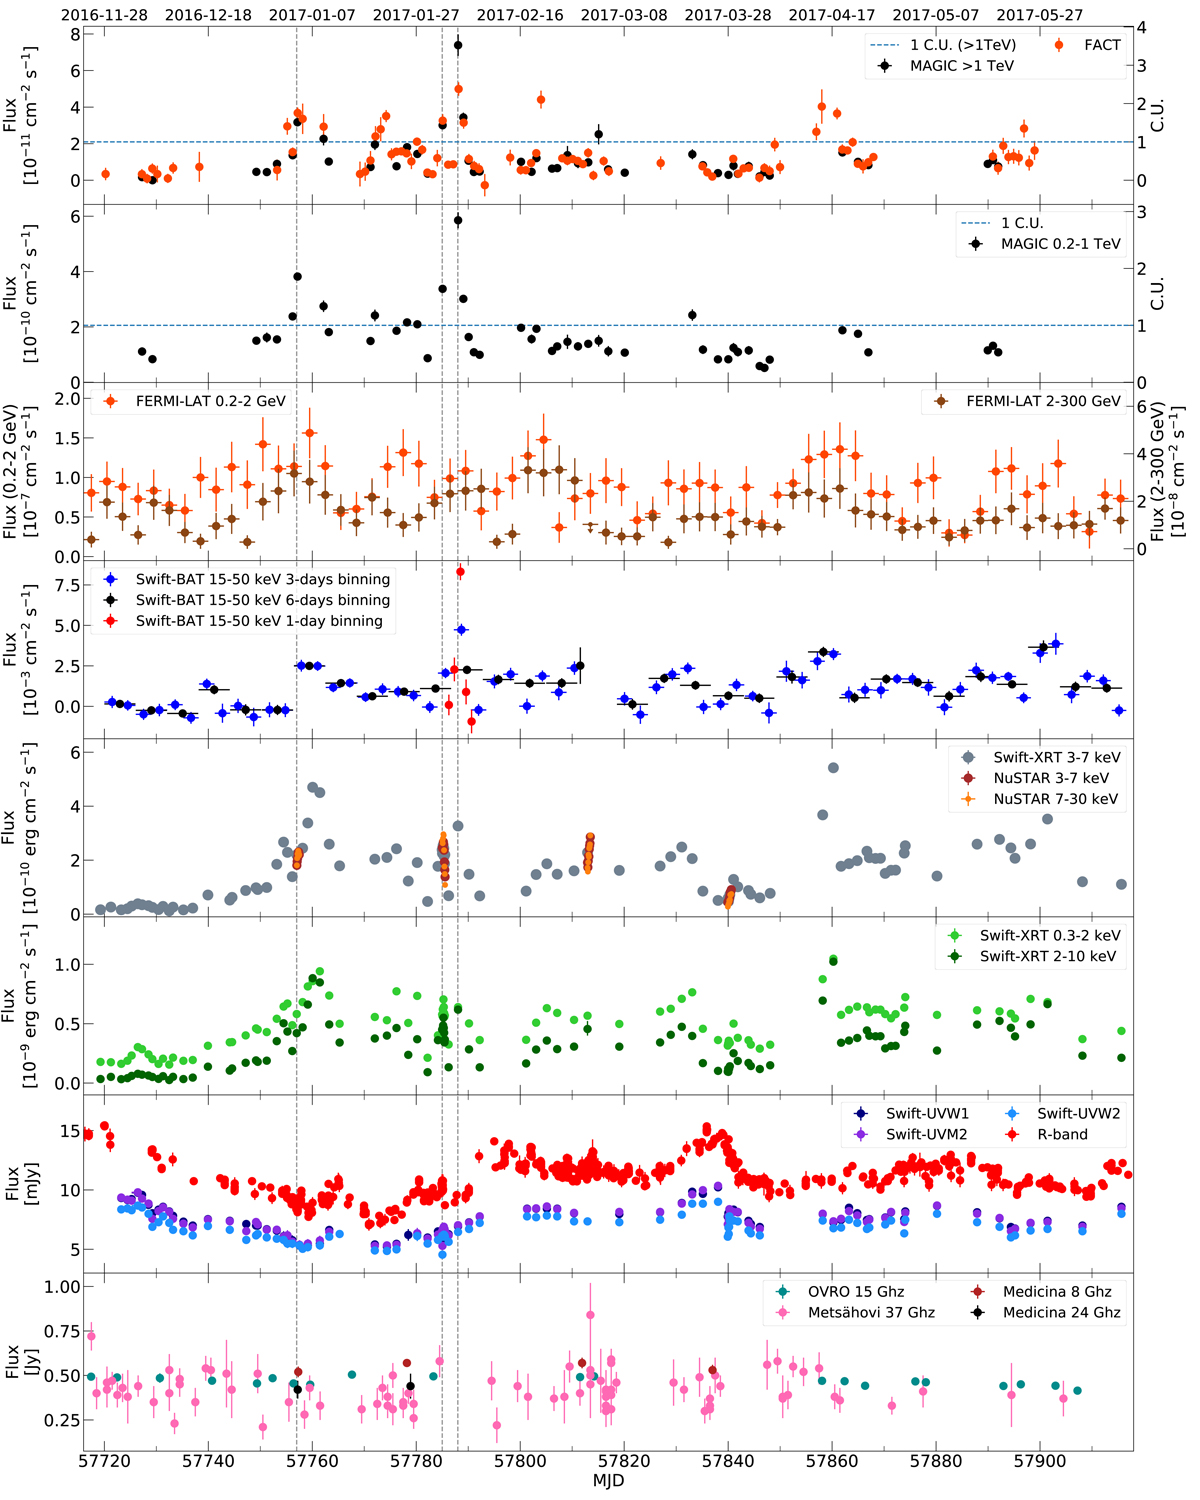
Fig. 1.
Download original image
MWL light curves between MJD 57720 and MJD 57918. From top to bottom: MAGIC (0.2–1 TeV & > 1 TeV) and FACT (> 0.95 TeV), Fermi-LAT (0.2–2 GeV & 2–300 GeV), Swift-BAT (15–50 keV), NuSTAR and Swift-XRT (3–7 keV & 7–30 keV), Swift-XRT (0.3–2 keV & 2–10 keV), UV-optical (Swift-UVW1/UVM2/UVW2 & R-band), OVRO (15 GHz), Metsähovi (37 GHz) and Medicina (8 GHz and 24 GHz). The dotted blue horizontal line in the first two panels from the top shows the 1 C.U. flux in the > 1 TeV & 0.2–1 TeV bands, respectively. The Fermi-LAT data have a 3-day binning. The Swift-BAT light curve is computed in 3-day and 6-day binnings, as well as 1-day binning around the flare. The vertical black dashed lines highlight the dates that show an enhanced VHE activity and appear as outliers in the VHE versus X-ray correlation plots (see Sect. 4).
Current usage metrics show cumulative count of Article Views (full-text article views including HTML views, PDF and ePub downloads, according to the available data) and Abstracts Views on Vision4Press platform.
Data correspond to usage on the plateform after 2015. The current usage metrics is available 48-96 hours after online publication and is updated daily on week days.
Initial download of the metrics may take a while.