Fig. 5
Download original image
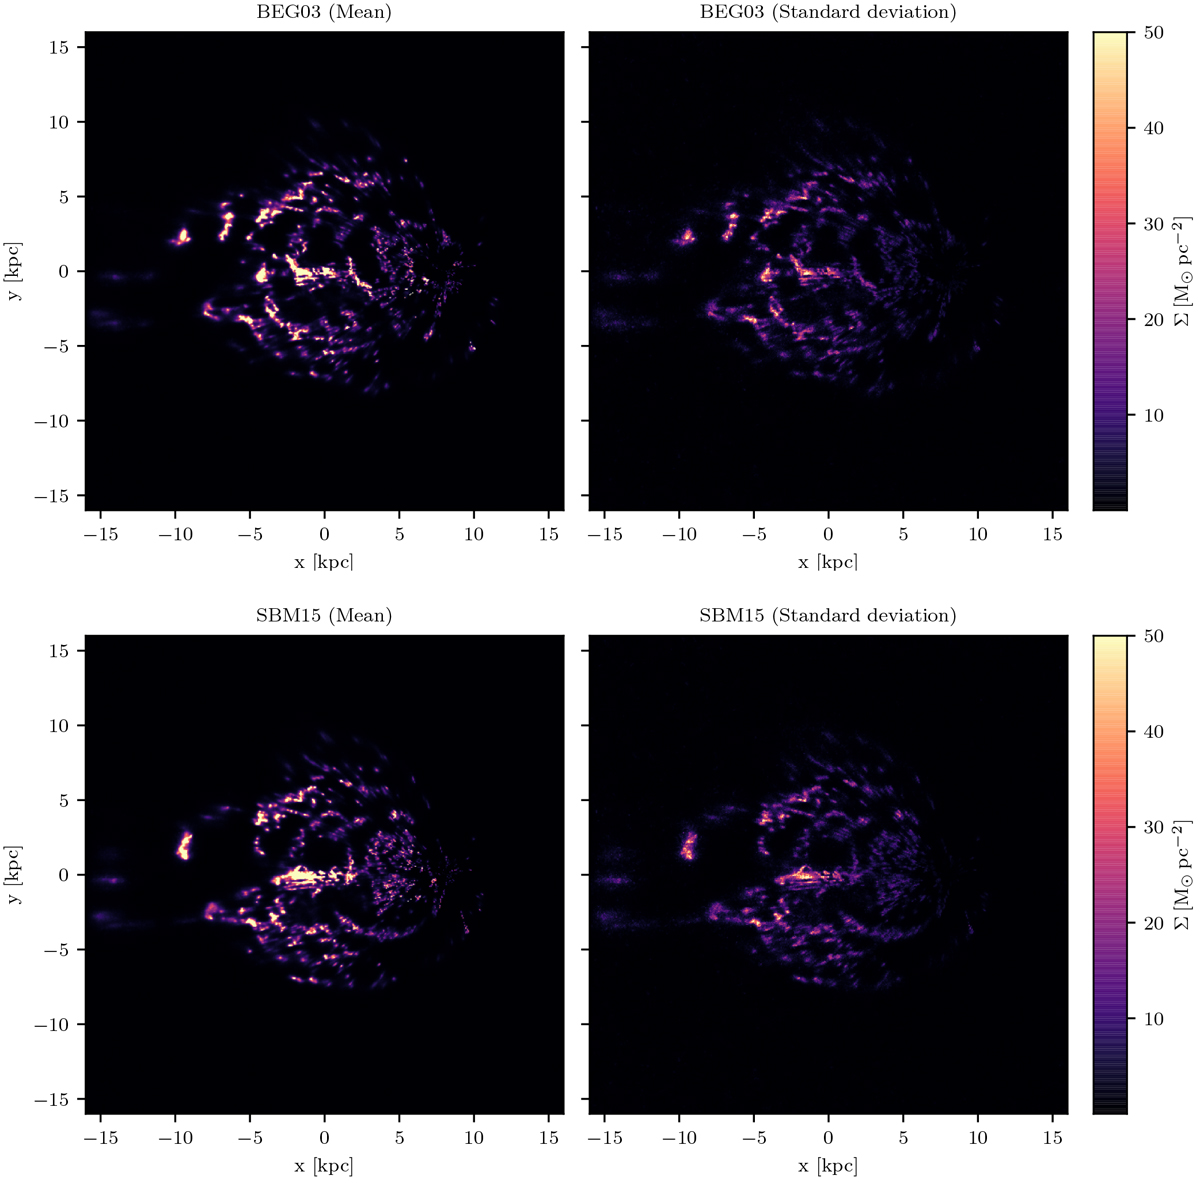
Two-dimensional projection of reconstructed three-dimensional maps of molecular hydrogen. Top left: mean gas surface density Σ for the BEG03 gas-flow model. Top right: standard deviation of the gas surface density Σ for the BEG03 gas-flow model. Bottom left: mean gas surface density Σ for the SBM15 model. Bottom right: standard deviation of the gas surface density Σ for the SBM15 model.
Current usage metrics show cumulative count of Article Views (full-text article views including HTML views, PDF and ePub downloads, according to the available data) and Abstracts Views on Vision4Press platform.
Data correspond to usage on the plateform after 2015. The current usage metrics is available 48-96 hours after online publication and is updated daily on week days.
Initial download of the metrics may take a while.