Fig. 4
Download original image
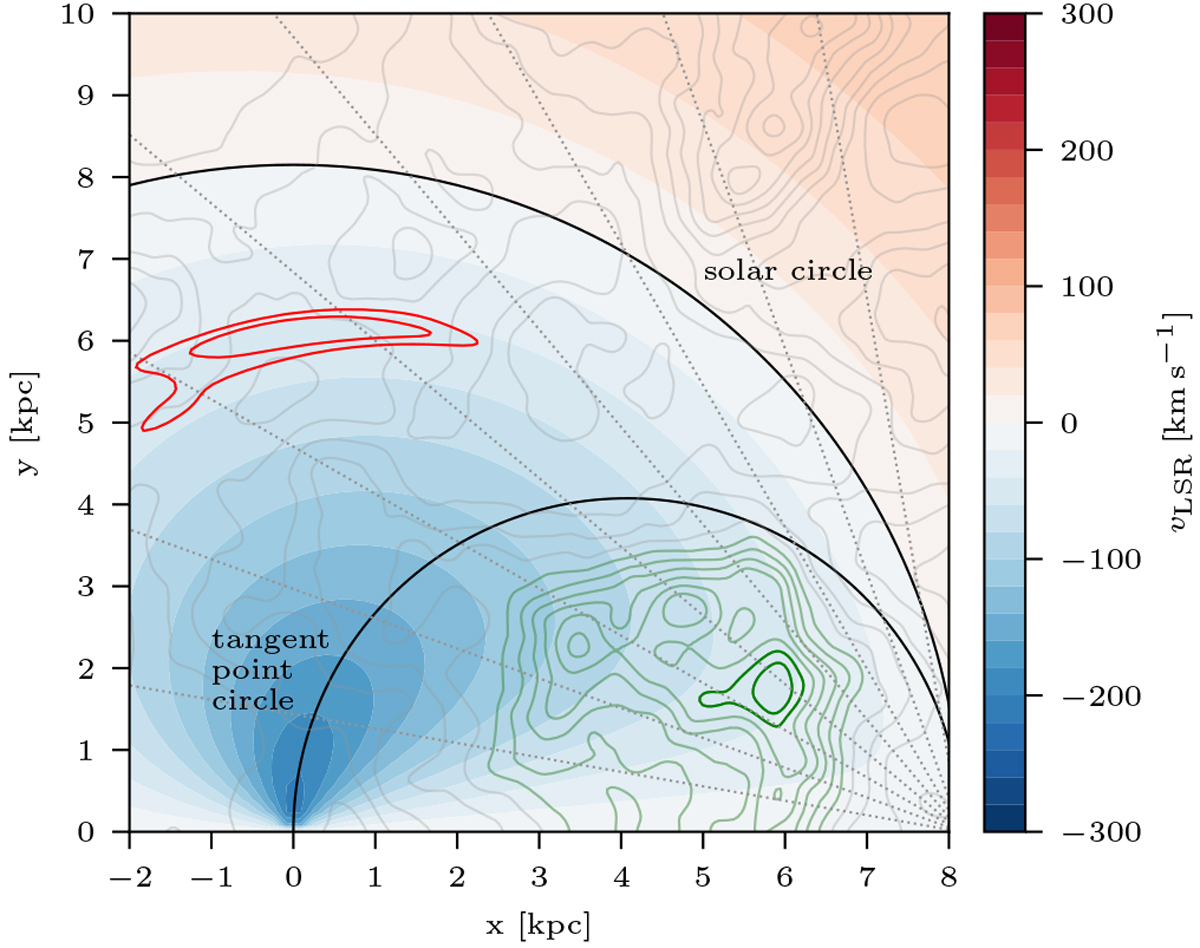
Part of the galactic plane of Fig. 1. The radial velocity for circular rotation is shown by the shaded regions. Thecontour lines indicate the density of a simulated log-normal density field with a power-law power spectrum. The solar circle, the tangent point circle, and the lines of constant longitude are indicated. The dark green contours delineate a high-density feature at the near distance embedded in a large complex, shown by the light green contours. The red contours at the far distance mark a feature that would look similar in gas-line survey data, but would be penalised by the correlation structure assumed in the Bayesian inference approach. See text for a discussion of how the correlation structure of the density helps resolving the near-far ambiguity.
Current usage metrics show cumulative count of Article Views (full-text article views including HTML views, PDF and ePub downloads, according to the available data) and Abstracts Views on Vision4Press platform.
Data correspond to usage on the plateform after 2015. The current usage metrics is available 48-96 hours after online publication and is updated daily on week days.
Initial download of the metrics may take a while.