Free Access
Fig. 2
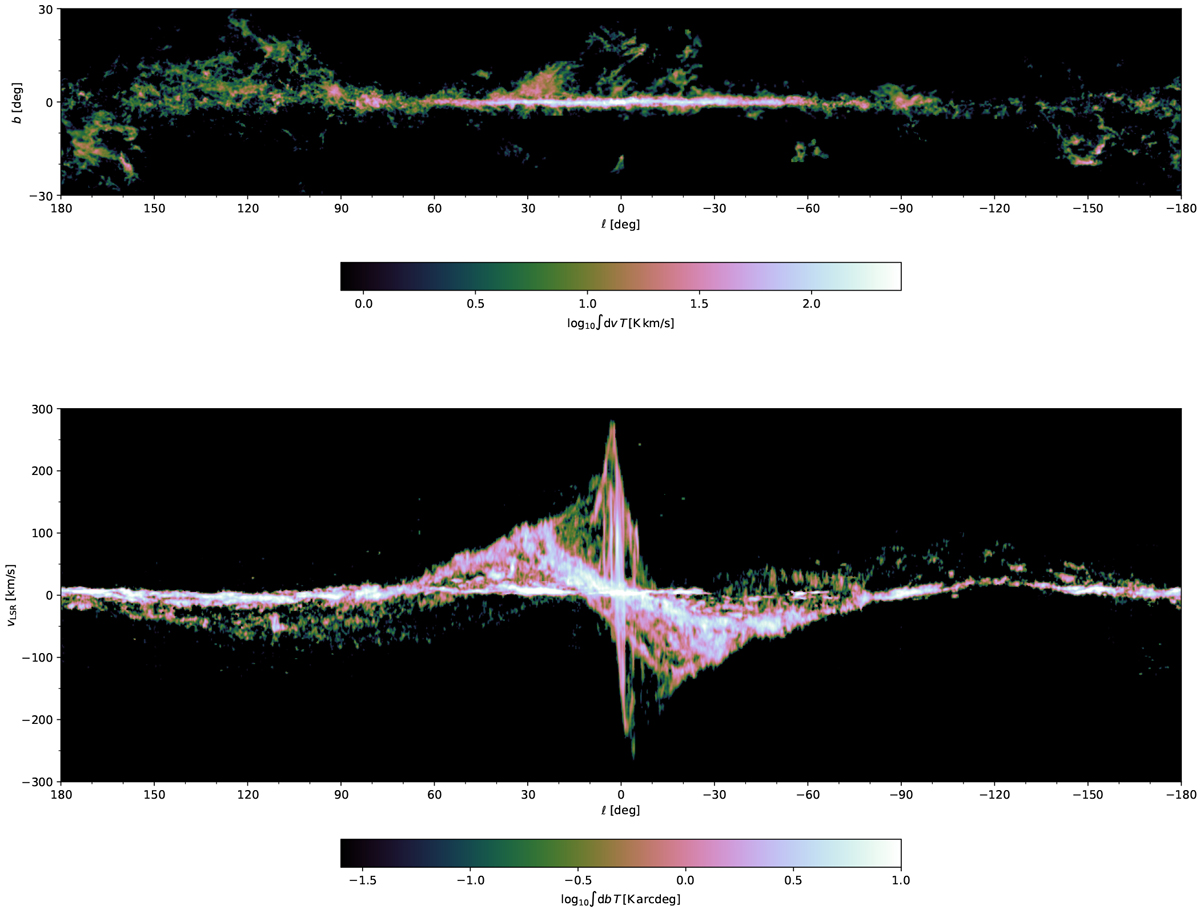
Download original image
Two-dimensional projections of the data from the Dame et al. (2001) compilation of surveys, after correcting for the updated local parameters. Top: velocity-integrated skymap of Galactic CO emission. Bottom: ℓ-v diagram of Galactic CO emission, integrated over latitudes from − 30° to 30°.
Current usage metrics show cumulative count of Article Views (full-text article views including HTML views, PDF and ePub downloads, according to the available data) and Abstracts Views on Vision4Press platform.
Data correspond to usage on the plateform after 2015. The current usage metrics is available 48-96 hours after online publication and is updated daily on week days.
Initial download of the metrics may take a while.