Fig. 8
Download original image
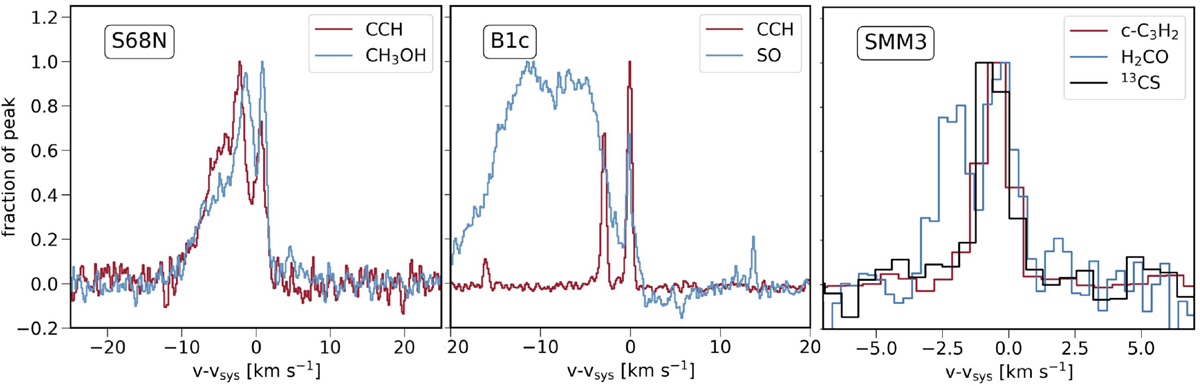
Spectra obtained at the cavity wall positions for hydrocarbons (red) and ice-mantle tracers (blue). Left: C2H 32.5,2 –21.5,1 (Eup = 25 K) and CH3OH 21,0 –10,1 (Eup = 28 K) spectra for S68N. Middle: C2H 32.5,2 –21.5,1 (Eup = 25 K) and SO 67–56 (Eup = 48 K) spectra for B1-c. Right: c-C3H2 44,1 –33,0 (Eup = 32 K), H2CO 32,1 –22,0 (Eup = 68 K), and 13CS 5–4 (Eup = 33 K) spectra for SMM3.
Current usage metrics show cumulative count of Article Views (full-text article views including HTML views, PDF and ePub downloads, according to the available data) and Abstracts Views on Vision4Press platform.
Data correspond to usage on the plateform after 2015. The current usage metrics is available 48-96 hours after online publication and is updated daily on week days.
Initial download of the metrics may take a while.