Fig. 7
Download original image
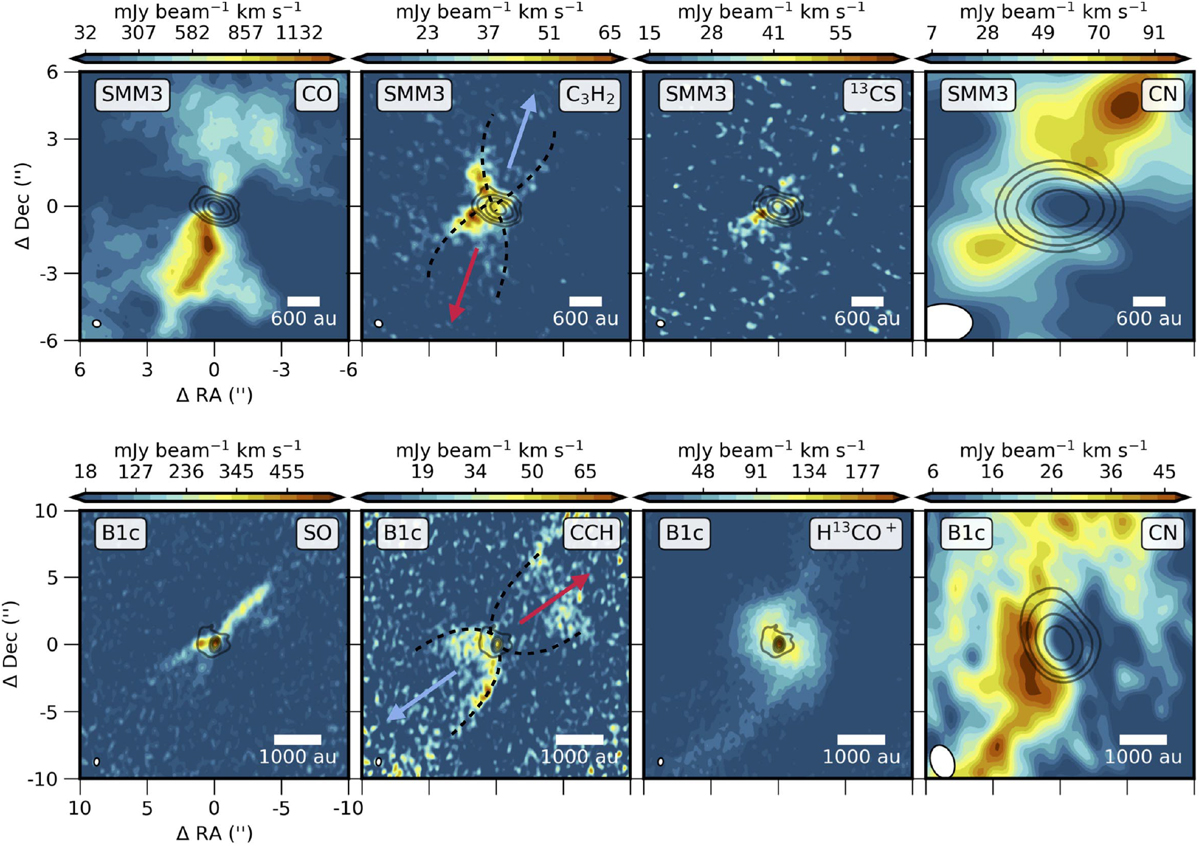
Maps of the outflow cavity wall tracers toward SMM3 and B1c, with the low-velocity outflow map for reference. Top: moment-0 maps toward SMM3 of CO 2–1, c-C3H2 61,6 –50,5, and 13CS 5–4 obtainedin band 6 at 0.′′5 resolution and CN 1–0 in band 3 at 3′′ with continuum emission at the same band and the resolution shown as black contours. Bottom: moment-0 maps toward B1c of SO 67–56, C2H 32.5,3 –21.5,1, and H13CO+ 3–2 obtainedat 0.′′5 and CN 1–0 at 3′′ resolution with continuum emission at the same band and the resolution shown as black contours. The emission is integrated from −5 to −1 km s−1 and from 1 to 5 km s−1 with respect to vlsr. Outflow directions and delineated cavity walls are shown in C2H and C3H2 maps.
Current usage metrics show cumulative count of Article Views (full-text article views including HTML views, PDF and ePub downloads, according to the available data) and Abstracts Views on Vision4Press platform.
Data correspond to usage on the plateform after 2015. The current usage metrics is available 48-96 hours after online publication and is updated daily on week days.
Initial download of the metrics may take a while.