Free Access
Fig. G.1
Download original image
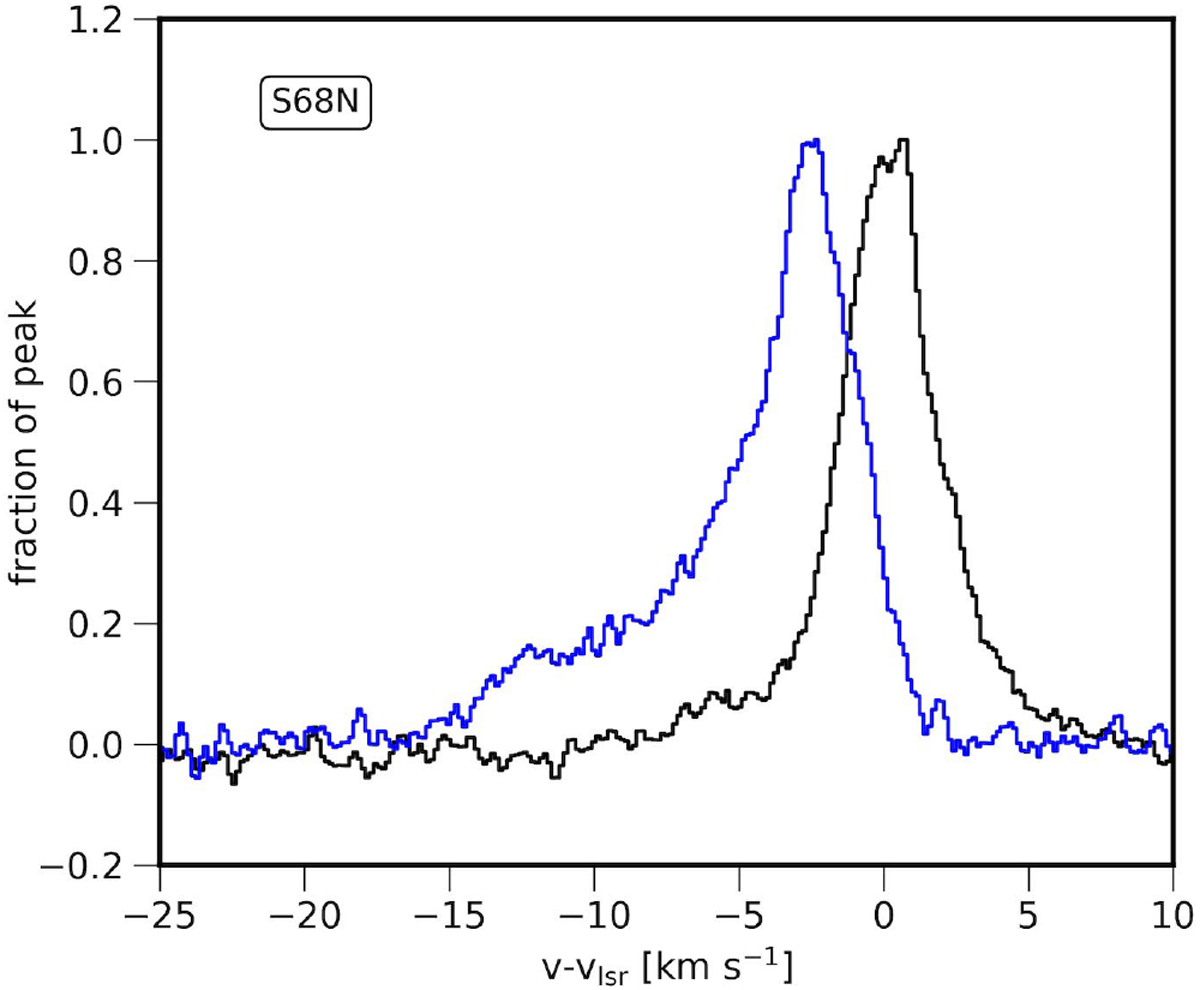
Spectra of SO 67–56 for S68N. Spectra averaged over the 0.′′6 diameter circle on positions of the central source (black) and the blueshifted outflow (blue). Both spectra normalized to the peak emission at the position.
Current usage metrics show cumulative count of Article Views (full-text article views including HTML views, PDF and ePub downloads, according to the available data) and Abstracts Views on Vision4Press platform.
Data correspond to usage on the plateform after 2015. The current usage metrics is available 48-96 hours after online publication and is updated daily on week days.
Initial download of the metrics may take a while.