Fig. 3
Download original image
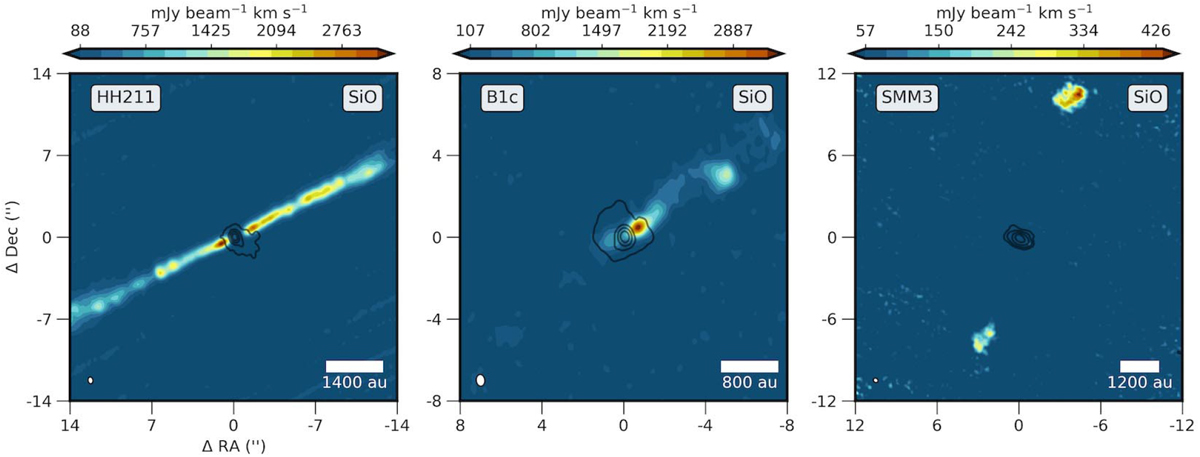
Maps of the EHV jets observed in SiO. Moment-0 maps are presented in color scale, in which continuum emission at 1.3 mm ispresented as black contours, both obtained with 12 m observations. SiO 4–3 map of HH211 integrated from −20 to −10 and from 10 to 20 km s−1 with respect to vsys, B1-c integrated from −70 to −40 and from 40 to 70 km s−1 with respect to vsys, and SMM3 integrated from −60 to −40 and from 20 to 35 km s−1 with respect to vsys.
Current usage metrics show cumulative count of Article Views (full-text article views including HTML views, PDF and ePub downloads, according to the available data) and Abstracts Views on Vision4Press platform.
Data correspond to usage on the plateform after 2015. The current usage metrics is available 48-96 hours after online publication and is updated daily on week days.
Initial download of the metrics may take a while.