Fig. E.1
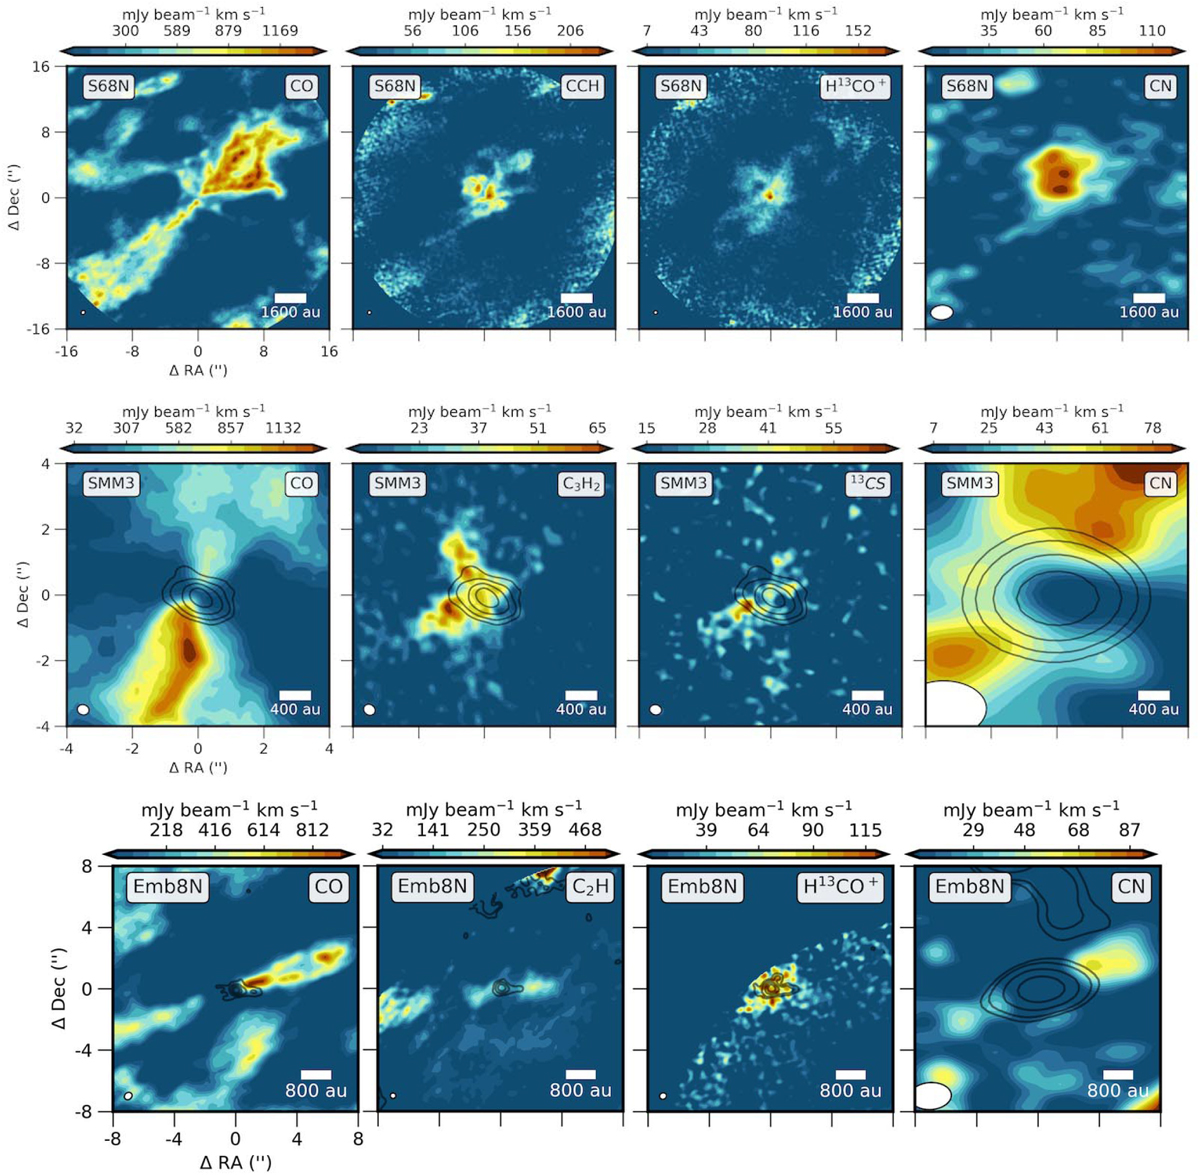
Download original image
Maps of the outflow cavity wall tracers toward S68N, TMC1, and Emb8N with the CO low-velocity outflow map for reference. Top: Moment-0 maps toward S68N of CO and C2H, H13CO+ obtained in band 6 at 0.′′5 resolution and CN in band 3 at 3′′. Middle: Moment-0 maps toward TMC1 of CO, c-C3H2, and 13CS and CN obtained at 0.′′5. The emission is integrated from -5 to -1 km s−1 and from 1 to 5 km s−1 with respec to vsys. Bottom: Moment-0 maps toward Emb8N of CO, c-C2H, and H13CO+ 13CS at 0.′′5 in band 6. and CN in band 3 at 3′′. The emission is integrated from -5 to 5 km s−1 with respect to vsys.
Current usage metrics show cumulative count of Article Views (full-text article views including HTML views, PDF and ePub downloads, according to the available data) and Abstracts Views on Vision4Press platform.
Data correspond to usage on the plateform after 2015. The current usage metrics is available 48-96 hours after online publication and is updated daily on week days.
Initial download of the metrics may take a while.