Fig. 2
Download original image
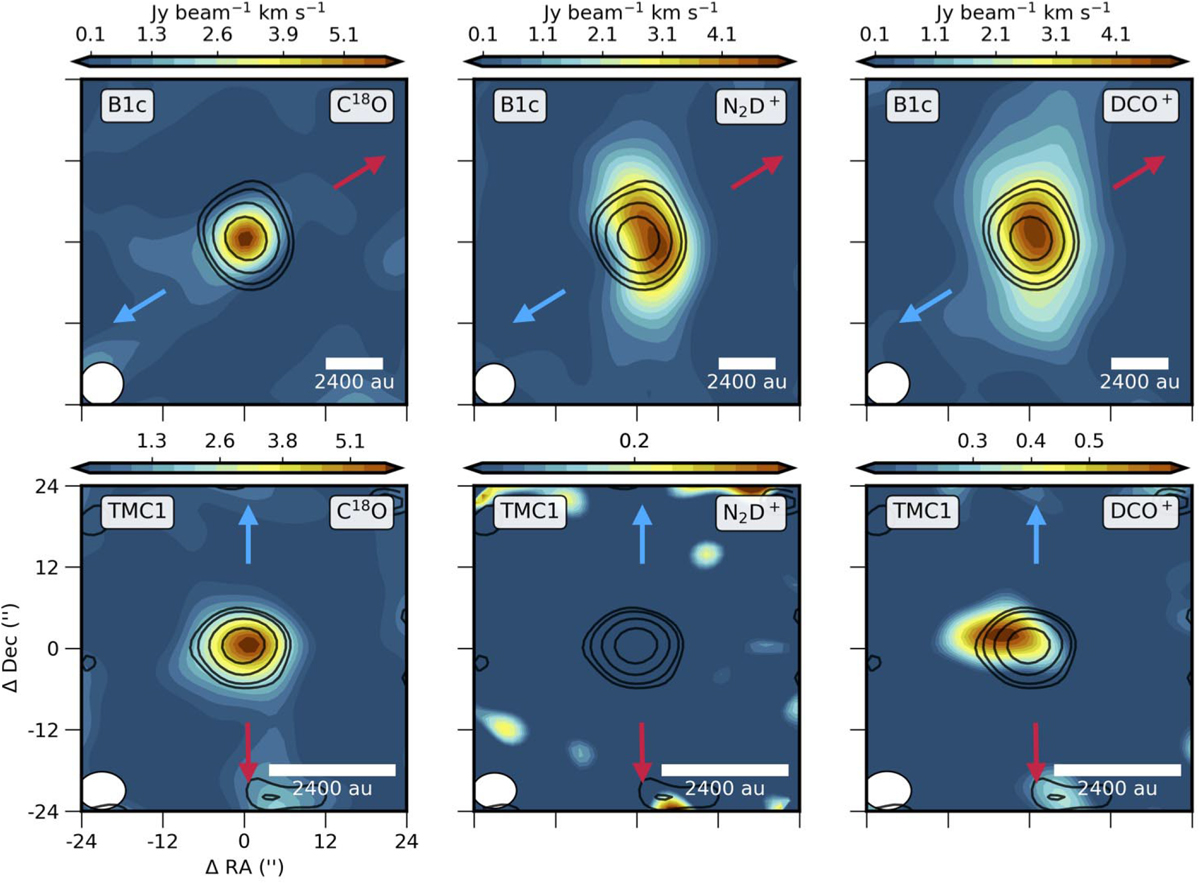
Maps of key envelope tracers toward B1-c (Class 0, top) and TMC1 (Class I, bottom) obtained with ACA. Contours represent continuum emission at 1.3 mm observed with ACA. Different distances to B1-c and TMC1 result in different spatial resolutions of the maps. Left: C18O 2–1. Middle: N2D+ 3–2. Right: DCO+ 3–2. All moment-0 maps are integrated from −2.5 to 2.5 km s−1 with respect to vsys.
Current usage metrics show cumulative count of Article Views (full-text article views including HTML views, PDF and ePub downloads, according to the available data) and Abstracts Views on Vision4Press platform.
Data correspond to usage on the plateform after 2015. The current usage metrics is available 48-96 hours after online publication and is updated daily on week days.
Initial download of the metrics may take a while.