Fig. 13
Download original image
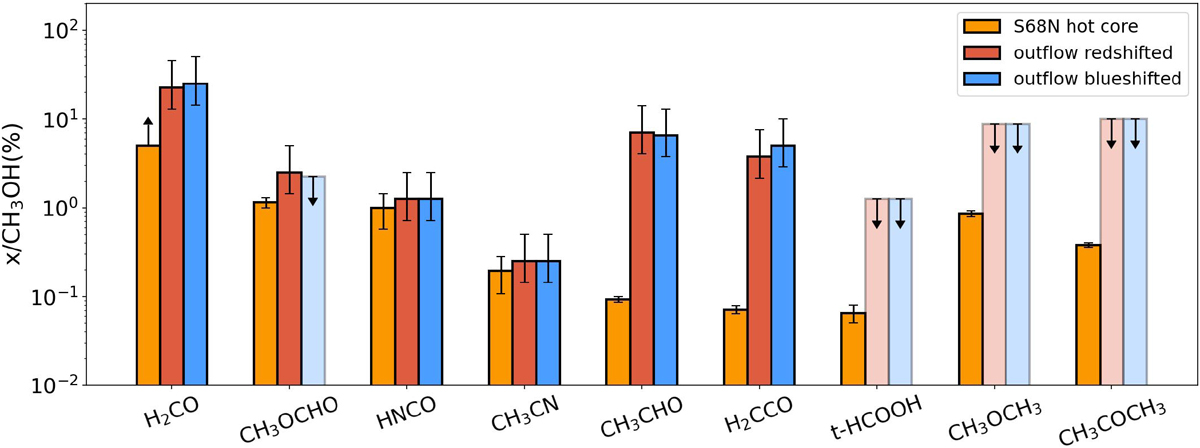
Ratio of complex organic molecules with respect to CH3OH in S68N. The ratios are shown for a 3′′ region in the red- and blueshifted part of the outflow. The abundance ratios in the hot cores are taken from van Gelder et al. (2020) and Nazari et al. (2021). The error bars mark the lower and upper limit on the ratios, as calculated from the optically thick CH3OH emission (lower limit) and 13CH3OH (upper limit). All outflow abundances obtained from the band 6 data are at 0.′′45 resolution, except for CH3OCHO and CH3CN, which were derived from band 3 data at 3′′ resolution.
Current usage metrics show cumulative count of Article Views (full-text article views including HTML views, PDF and ePub downloads, according to the available data) and Abstracts Views on Vision4Press platform.
Data correspond to usage on the plateform after 2015. The current usage metrics is available 48-96 hours after online publication and is updated daily on week days.
Initial download of the metrics may take a while.