Fig. 12
Download original image
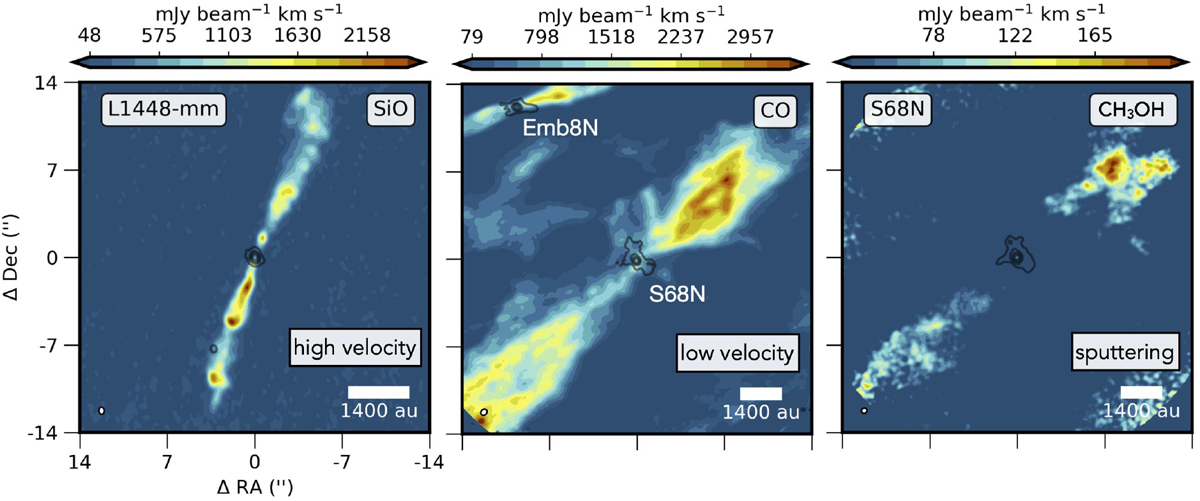
Maps of three different outflow components. Moment-0 maps are presented in color scale, and the continuum emission at 1.3 mm is plotted in black. Both were obtained with ALMA 12 m observations. Left: EHV molecular jet illustrated with the SiO (4–3) map for L1448-mm integrated from −70 to −50 and from 50 to 70 km s−1 with respect to vsys. Middle: low-velocity outflow illustrated with the CO 2–1 map for S68N integrated from −15 to −3 and from 3 to 15 km s−1 with respect to vsys. Right: ice-mantle content released with shock sputtering presented with the CH3OH (21,0 – 10,0) map for S68N integrated from −8 to −1 and from 1 to 8 km s−1 with respect to vsys. The CO outflow from Ser-emb-8N is present at the edge of the map.
Current usage metrics show cumulative count of Article Views (full-text article views including HTML views, PDF and ePub downloads, according to the available data) and Abstracts Views on Vision4Press platform.
Data correspond to usage on the plateform after 2015. The current usage metrics is available 48-96 hours after online publication and is updated daily on week days.
Initial download of the metrics may take a while.