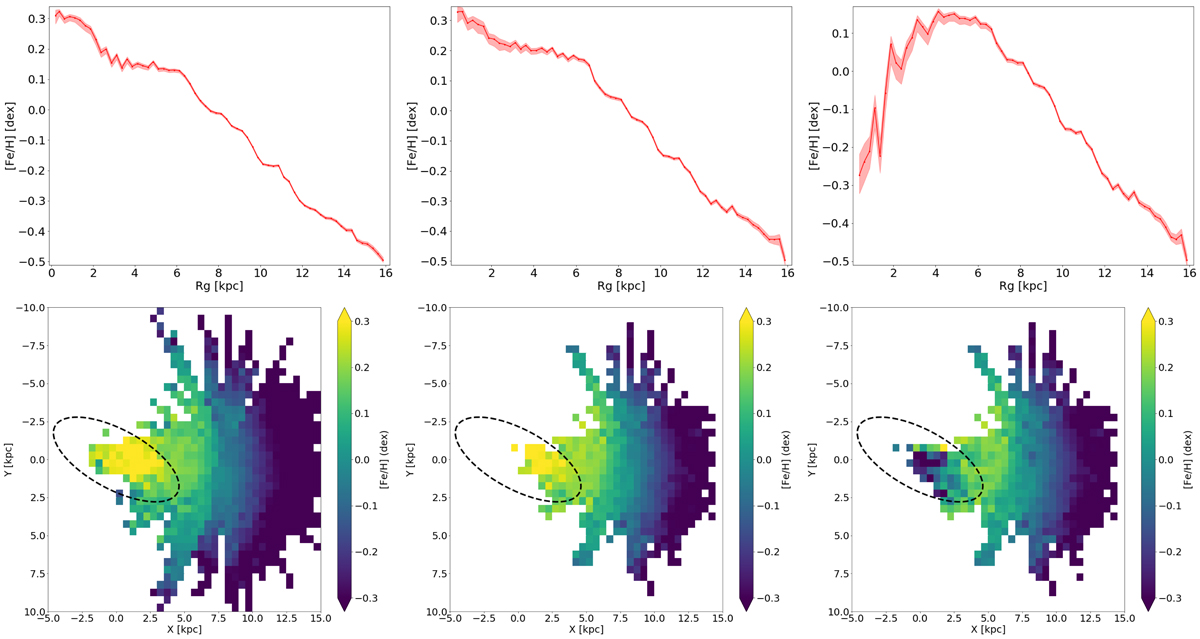
Fig. C.1.
Download original image
Top row: Median metallicity trend as a function of guiding radius for three different samples: the thin disc stars contained in the ±2 kpc layer around the Galactic plane (left), the thin disc stars in the ±300 pc layer (middle), and all the disc stars in the ±300 pc layer (right). The left plot is the same as Fig. 5, reproduced here to facilitate the comparison. The medians are calculated per bin of 250 pc. The shaded area delimits the ±1σ uncertainty on the estimate of the median. Bottom row: Median metallicity (X-Y) maps for the same three samples as on the top row: thin disc with Z ∈ [ − 2, 2] kpc (left), thin disc with Z ∈ [ − 300, 300] pc (middle), and full disc with Z ∈ [ − 300, 300] pc (right). X and Y are the Cartesian Galactic coordinates, with the Galactic centre located at X = Y = 0 kpc and the Sun at X = 8.125 kpc and Y = 0 kpc. The Galaxy rotates clockwise. The bar is schematically represented, as in Bovy et al. (2019), by a dashed ellipse with a semi-major axis of 5 kpc and an axis ratio of 0.4, inclined by 25° with respect to the Galactic centre-Sun direction.
Current usage metrics show cumulative count of Article Views (full-text article views including HTML views, PDF and ePub downloads, according to the available data) and Abstracts Views on Vision4Press platform.
Data correspond to usage on the plateform after 2015. The current usage metrics is available 48-96 hours after online publication and is updated daily on week days.
Initial download of the metrics may take a while.