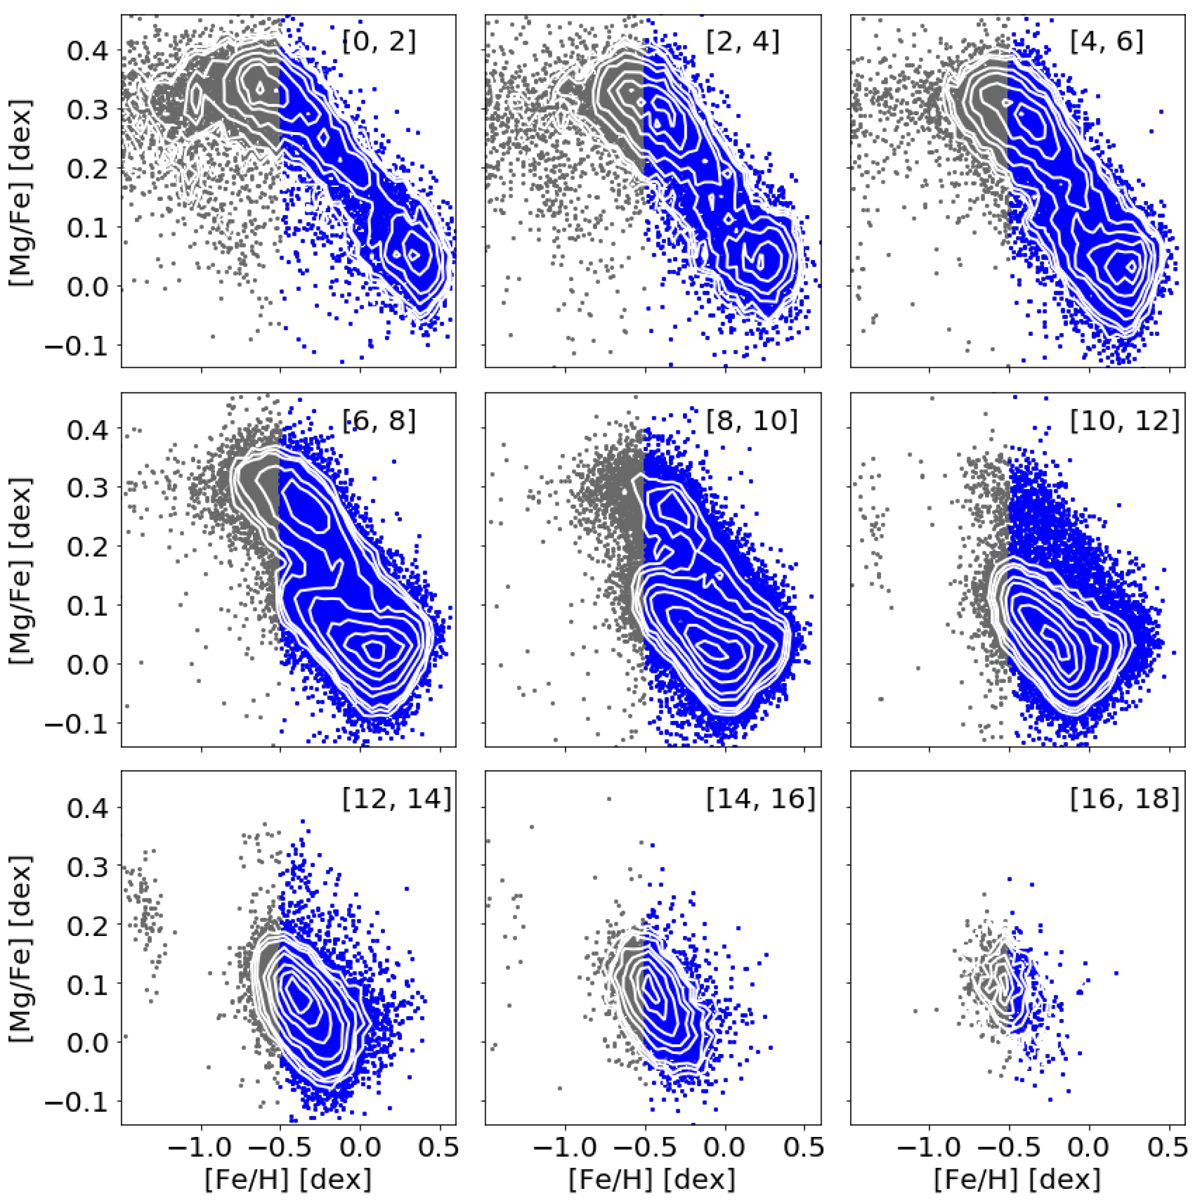
Fig. B.1.
Download original image
Distribution of the main sample stars in the ([Fe/H], [Mg/Fe]) plane for different intervals of guiding radius, from Rg ∈ [0, 2] kpc (top left) to [16, 18] kpc (bottom right). The stars of the age sample are represented as blue dots, while the grey dots are stars from the main sample with invalid ages. The white lines are stellar density iso-contours drawn at 90%, 70%, 50%, 30%, 20%, 10%, 7.5%, and 5% of the peak density.
Current usage metrics show cumulative count of Article Views (full-text article views including HTML views, PDF and ePub downloads, according to the available data) and Abstracts Views on Vision4Press platform.
Data correspond to usage on the plateform after 2015. The current usage metrics is available 48-96 hours after online publication and is updated daily on week days.
Initial download of the metrics may take a while.