Fig. 9.
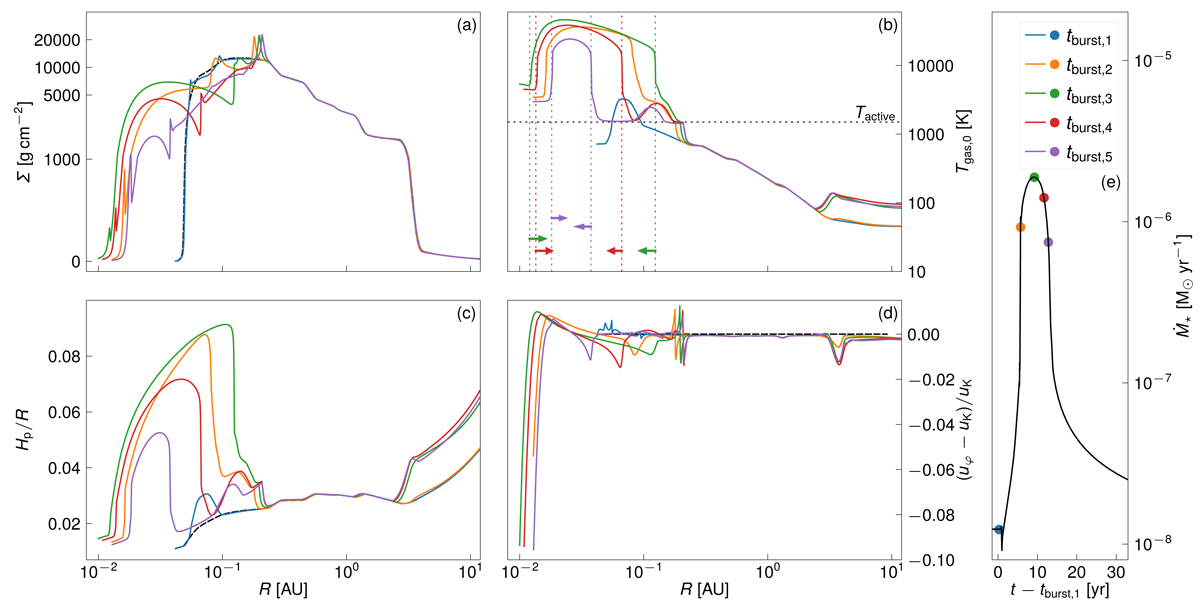
Download original image
Panels a–c, as well as (e), are the same disk properties as in Fig. 7, but for five points in time tburst, 1 to tburst, 5 during an outburst. Panel d: same quantity as (e) in Fig. 7. The dashed black line in panels a–d denote the stationary initial model as described in Sect. 3.5. The radial range in this plot is chosen from rin to 10 AU. The color-coded, dashed vertical lines and corresponding arrows mark the position of the cooling waves and their propagation direction, respectively.
Current usage metrics show cumulative count of Article Views (full-text article views including HTML views, PDF and ePub downloads, according to the available data) and Abstracts Views on Vision4Press platform.
Data correspond to usage on the plateform after 2015. The current usage metrics is available 48-96 hours after online publication and is updated daily on week days.
Initial download of the metrics may take a while.