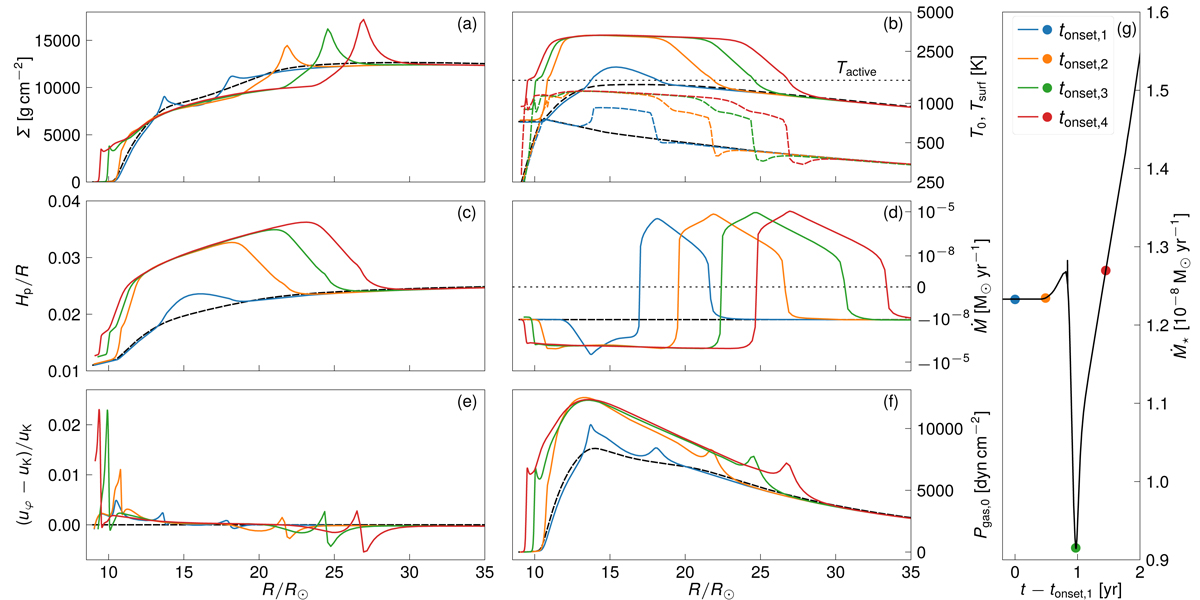
Fig. 7.
Download original image
Various disk quantities for certain times tonset, 1 − tonset, 4 describing an outburst onset phase. Panels a–c: radial surface density structure Σ and the pressure scale-height Hp during the onset of an outburst, respectively. Panel b: midplane gas temperature T0 (solid) and the surface temperature Tsurf (dashed). The dotted line marks the activation temperature Tactive. Panel d: radial mass transport rate Ṁ, where the dotted line corresponds to Ṁ = 0. The deviation from a Keplerian accretion disk is shown in panel e, whereas panel f: gas pressure at the midplane Pgas, 0. Finally, panel g maps the various snapshots in time to the stages during the onset of an outburst. The dashed black line in panels a–f denote the stationary initial model as described in Sect. 3.5.
Current usage metrics show cumulative count of Article Views (full-text article views including HTML views, PDF and ePub downloads, according to the available data) and Abstracts Views on Vision4Press platform.
Data correspond to usage on the plateform after 2015. The current usage metrics is available 48-96 hours after online publication and is updated daily on week days.
Initial download of the metrics may take a while.