Fig. 5.
Download original image
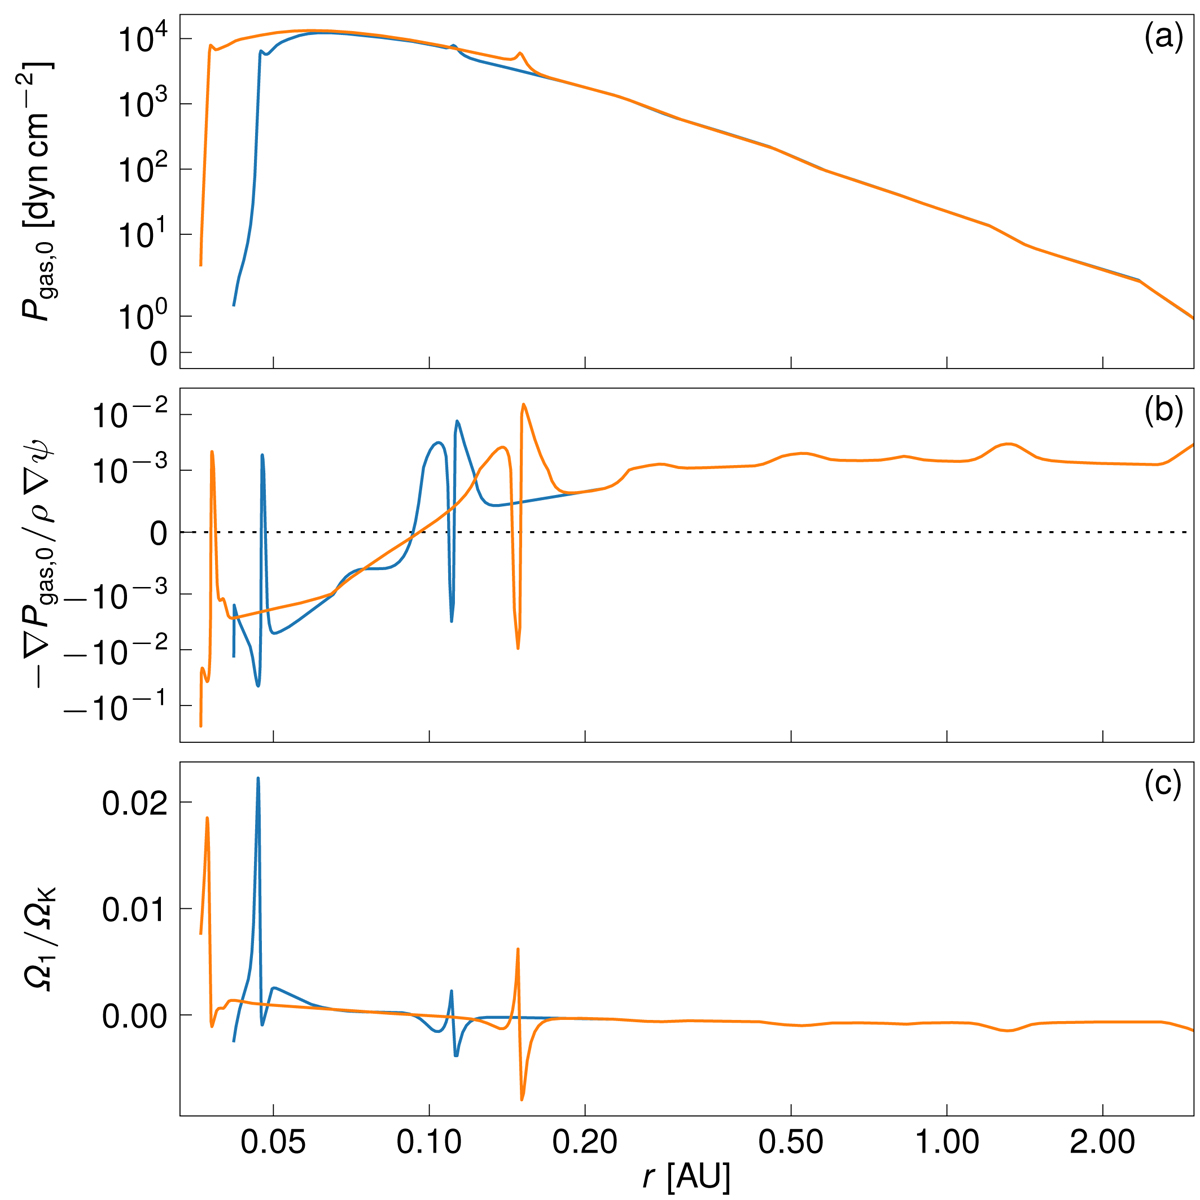
a: midplane gas pressure Pgas, 0 between 0.04 AU and 2 AU for two different times during an FU Ori like outburst. b: midplane pressure gradient force −∇Pgas, 0 relative to the gravitational force is plotted. The radially localized changes in sign occur at the positions of the ionization fronts running inwards and outwards. The deviation from the Keplerian angular velocity is shown in (c).
Current usage metrics show cumulative count of Article Views (full-text article views including HTML views, PDF and ePub downloads, according to the available data) and Abstracts Views on Vision4Press platform.
Data correspond to usage on the plateform after 2015. The current usage metrics is available 48-96 hours after online publication and is updated daily on week days.
Initial download of the metrics may take a while.