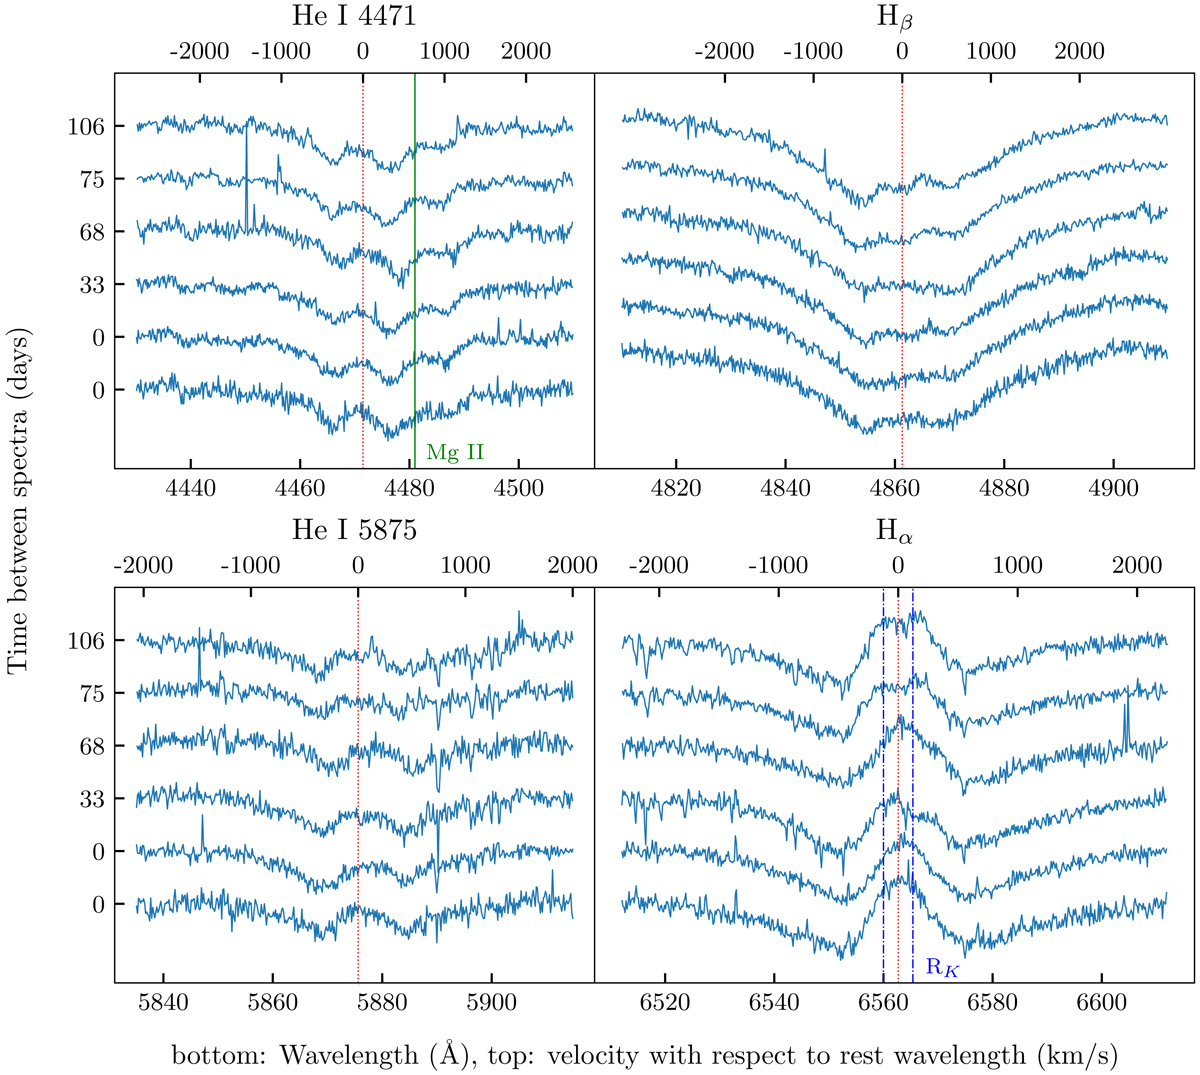
Fig. 2.
Download original image
Spectral trail of hydrogen and helium lines visible in the spectrum of J22564–5910. The rest wavelength of each line is shown in red dotted line. On the top left plot the Mg IIλ 4483 line is marked in green. On the bottom right plot the location of RK is indicated in blue dash-dotted line (see Sect. 6.1). The spectra are shown in order of observations – the time since the first spectrum is shown on the y axis. The bottom three spectra were taken with UVES, while the top three spectra were taken with X-shooter. The first two UVES spectra were taken back to back. The axes on the bottom of the plot shows wavelength, while that on the top shows velocity compared to the rest wavelength.
Current usage metrics show cumulative count of Article Views (full-text article views including HTML views, PDF and ePub downloads, according to the available data) and Abstracts Views on Vision4Press platform.
Data correspond to usage on the plateform after 2015. The current usage metrics is available 48-96 hours after online publication and is updated daily on week days.
Initial download of the metrics may take a while.