Fig. 1
Download original image
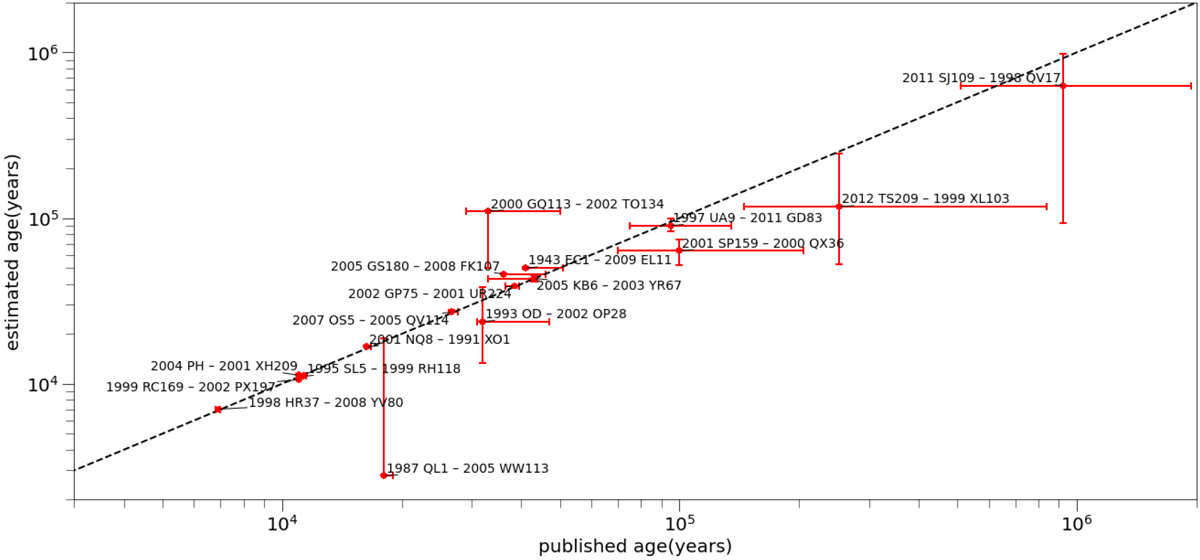
Age comparison between our pipeline and the literature. The x-axis of the plot shows the formation times of these pairs taken from the literature, and the y-axis shows the corresponding times calculated by our program. The red lines are the error bars for both cases. The black dashed line represents the case when both results are in perfect agreement.
Current usage metrics show cumulative count of Article Views (full-text article views including HTML views, PDF and ePub downloads, according to the available data) and Abstracts Views on Vision4Press platform.
Data correspond to usage on the plateform after 2015. The current usage metrics is available 48-96 hours after online publication and is updated daily on week days.
Initial download of the metrics may take a while.