Fig. 8
Download original image
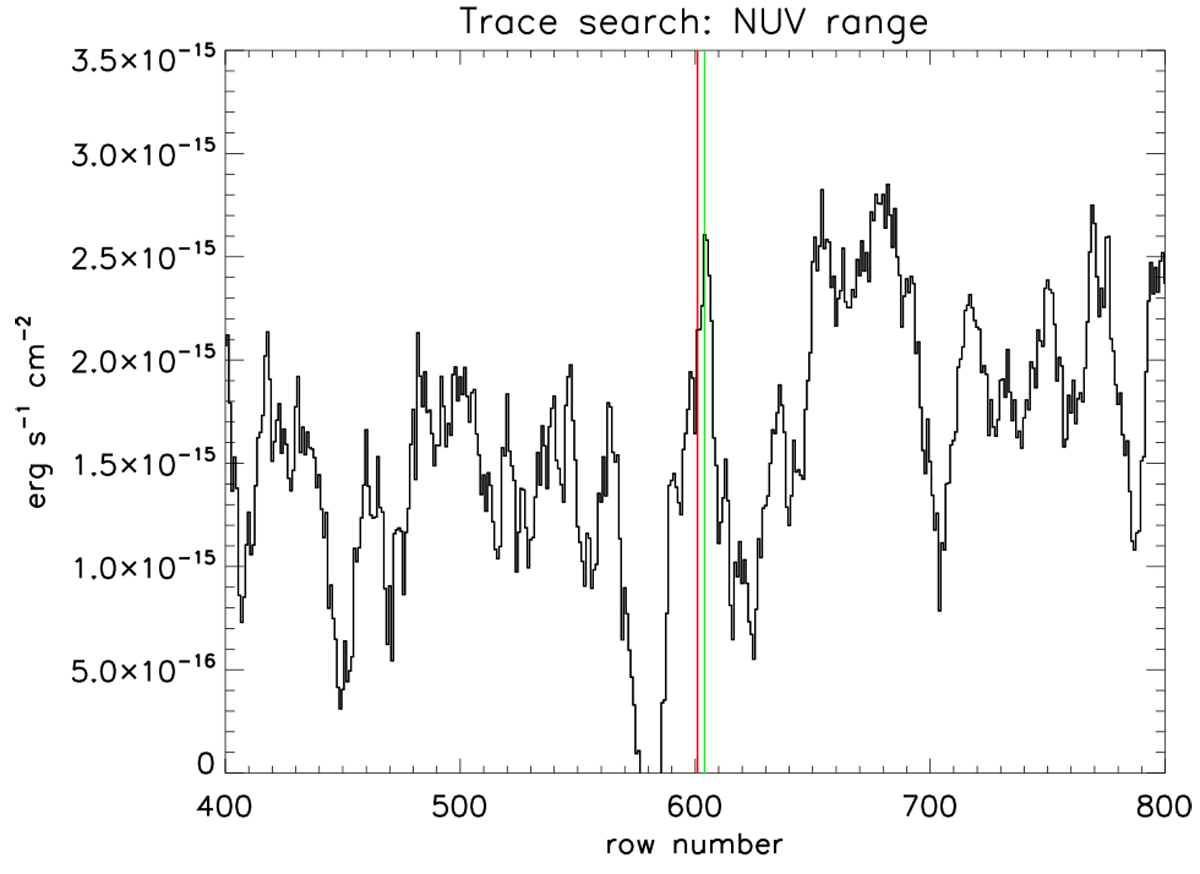
Trace search for NUV signal. Integrated fluxes along the axis of dispersion (along rows) as a function of row number. The black curves shows integrated fluxes within the wavelength range 2200–3110 Å and the blue curve fluxes within 3065 and 3110 Å. The vertical red line indicates the row where the target is expected to be located and the green line indicates a shift of three rows where flux displays a local maximum.
Current usage metrics show cumulative count of Article Views (full-text article views including HTML views, PDF and ePub downloads, according to the available data) and Abstracts Views on Vision4Press platform.
Data correspond to usage on the plateform after 2015. The current usage metrics is available 48-96 hours after online publication and is updated daily on week days.
Initial download of the metrics may take a while.