Fig. 7
Download original image
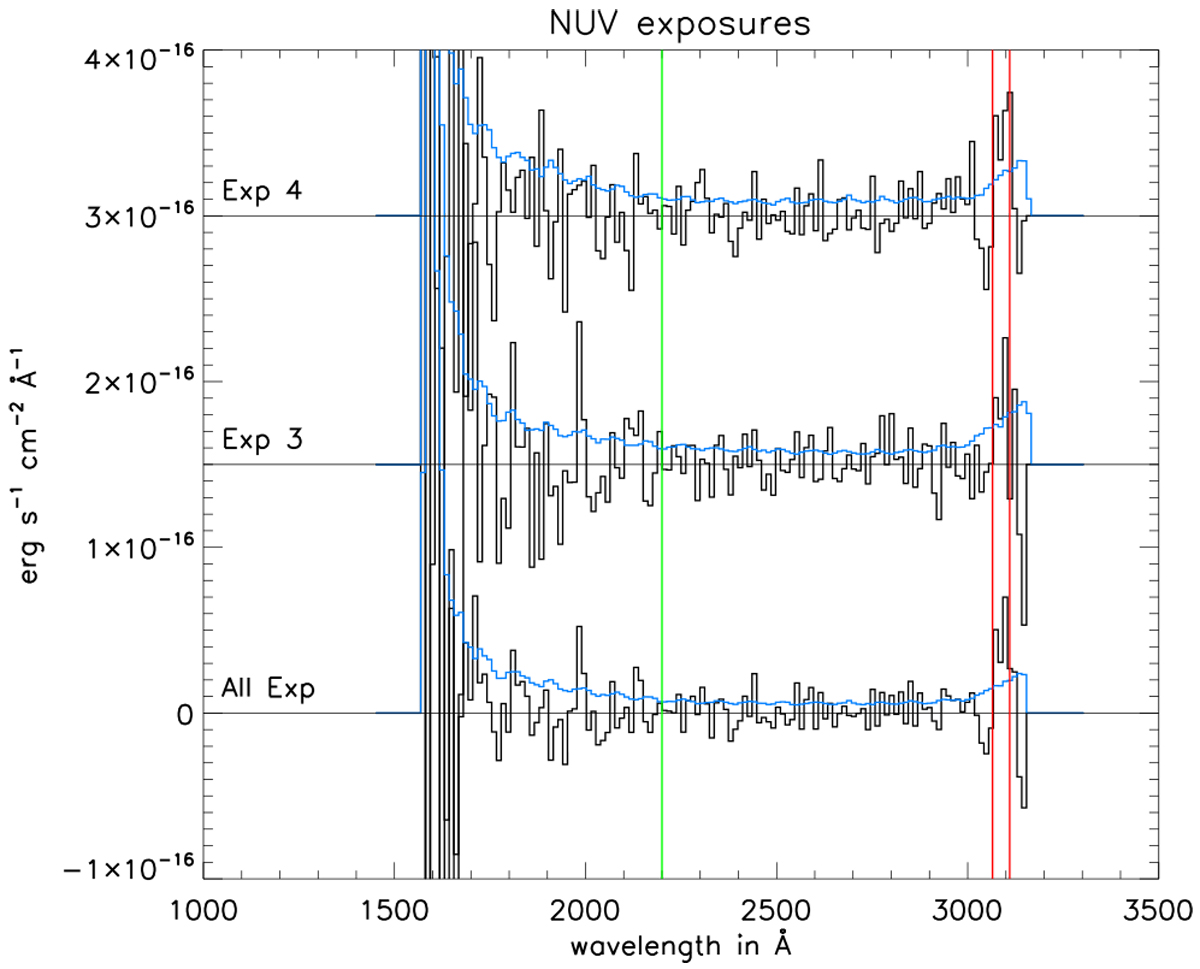
Near-UV spectra of exposures 3 and 4, and combined spectrum. The spectra are separated by constant offsets for display purposes. The two red vertical lines indicate the wavelength band 3065–3110 Å displaying the most significant flux within the spectra, which might stem from TiO emission. The green line indicates 2200 Å (see text). In light blue we display the uncertainty spectrum calculated with the variance method described in Appendix B.1.
Current usage metrics show cumulative count of Article Views (full-text article views including HTML views, PDF and ePub downloads, according to the available data) and Abstracts Views on Vision4Press platform.
Data correspond to usage on the plateform after 2015. The current usage metrics is available 48-96 hours after online publication and is updated daily on week days.
Initial download of the metrics may take a while.