Fig. 12
Download original image
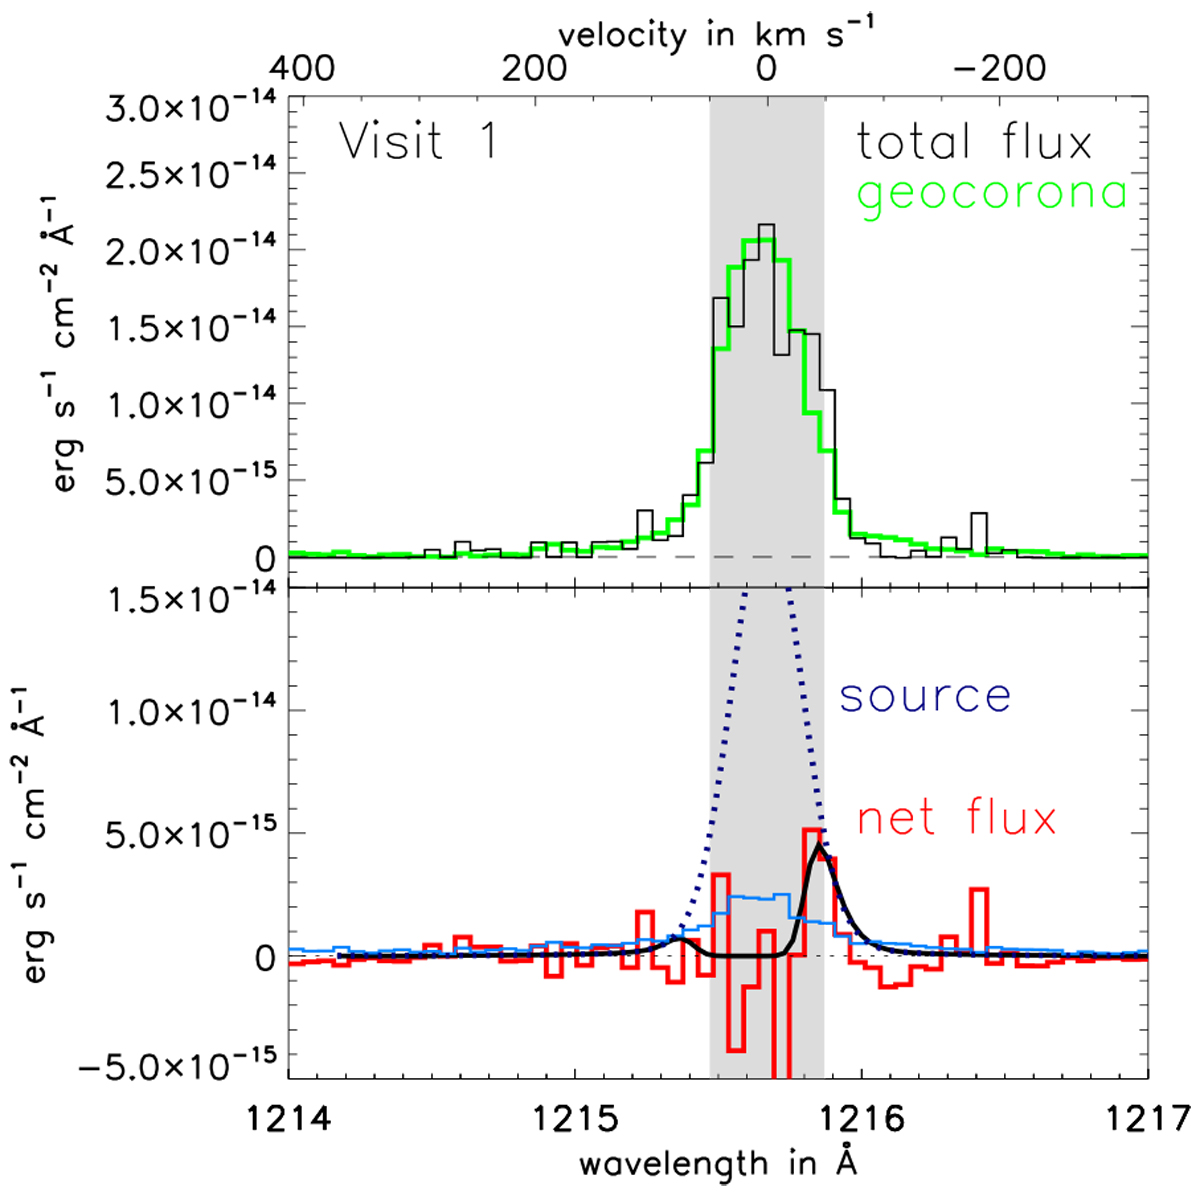
Ly-α spectrum of Visit 1 of 2MASS J1237+6526. Top panel: total flux and geocoronal emission within the slit determined from rows away from the target. Bottom panel: net flux from the target and the possible source flux (see text for details). In light blue we display the uncertainty spectrum calculated with the variance method described in Appendix B.1.
Current usage metrics show cumulative count of Article Views (full-text article views including HTML views, PDF and ePub downloads, according to the available data) and Abstracts Views on Vision4Press platform.
Data correspond to usage on the plateform after 2015. The current usage metrics is available 48-96 hours after online publication and is updated daily on week days.
Initial download of the metrics may take a while.