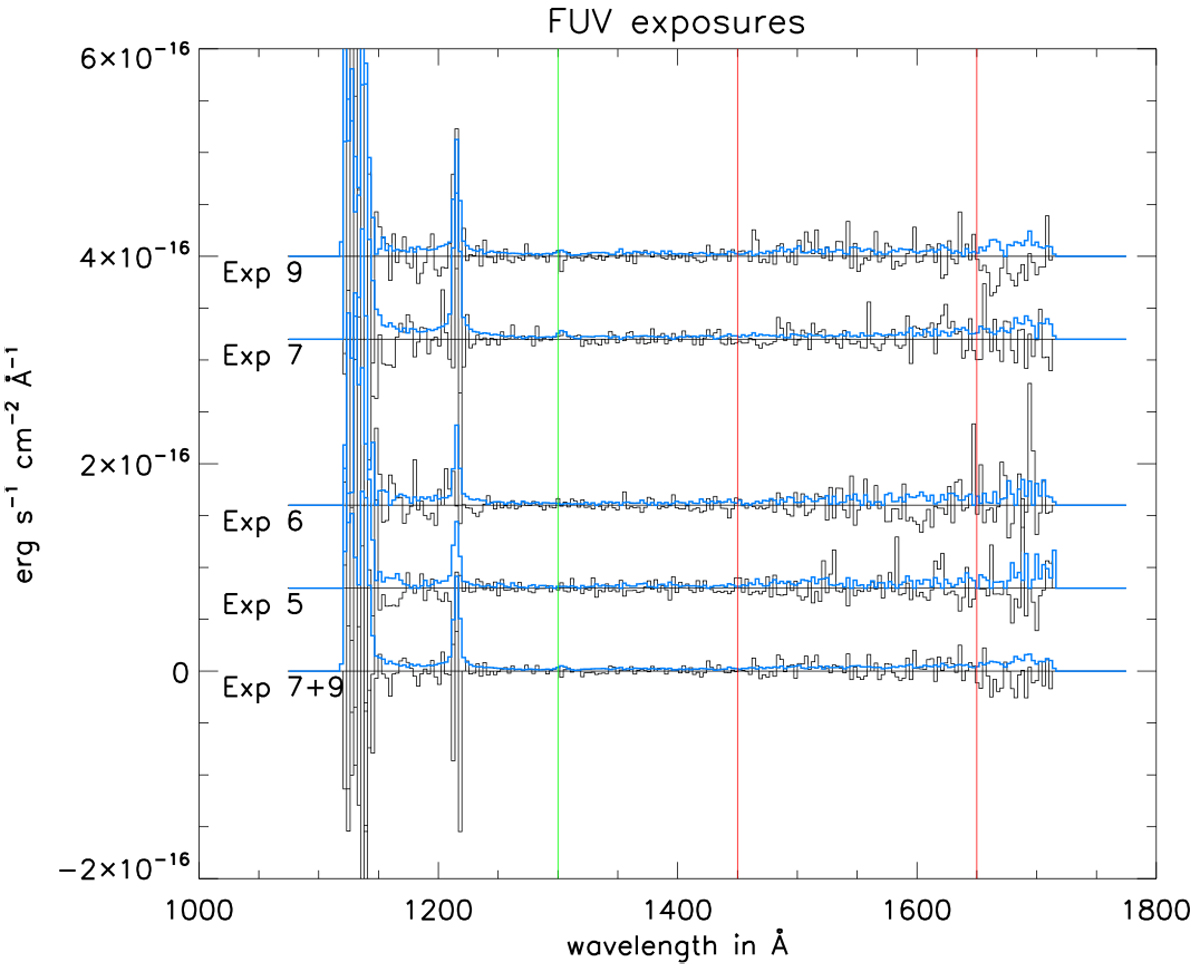
Fig. 10
Download original image
Far-UV spectra of 2MASS J1237+6526. The spectra are shifted by a constant offset for display purposes. The red lines at 1450 and 1650 Å and the green line at 1300 Å indicate the region within which integrated fluxes are calculated (see text). In light blue we display the uncertainty spectrum calculated with the variance method described in Appendix B.1.
Current usage metrics show cumulative count of Article Views (full-text article views including HTML views, PDF and ePub downloads, according to the available data) and Abstracts Views on Vision4Press platform.
Data correspond to usage on the plateform after 2015. The current usage metrics is available 48-96 hours after online publication and is updated daily on week days.
Initial download of the metrics may take a while.