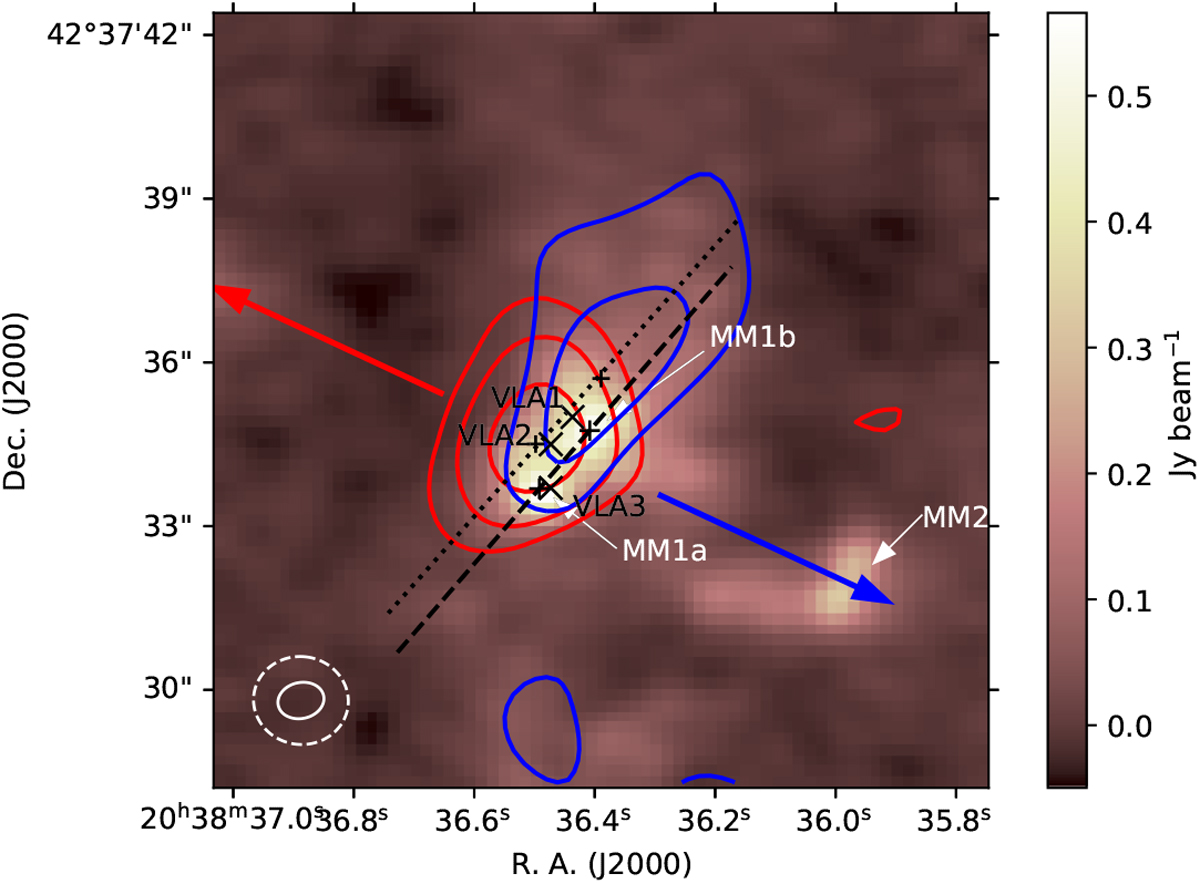
Fig. 6
Download original image
Continuum image of N30, with the red- and blueshifted 342.88 GHz CS line transition J = 7− 6 shown in contours. As with the H2CO line, CS shows red- and blueshifted emission along the same outflow axis. The blueshifted emission shows some extended emission further out to the northeast, while the redshifted emission is slightly more concentrated than for H2CO. Here, the velocity ranges extend to ±15.6 km s−1 from the systemic velocity of 8.75 km s−1. Beam sizes and contour levels are as in Fig. 3.
Current usage metrics show cumulative count of Article Views (full-text article views including HTML views, PDF and ePub downloads, according to the available data) and Abstracts Views on Vision4Press platform.
Data correspond to usage on the plateform after 2015. The current usage metrics is available 48-96 hours after online publication and is updated daily on week days.
Initial download of the metrics may take a while.