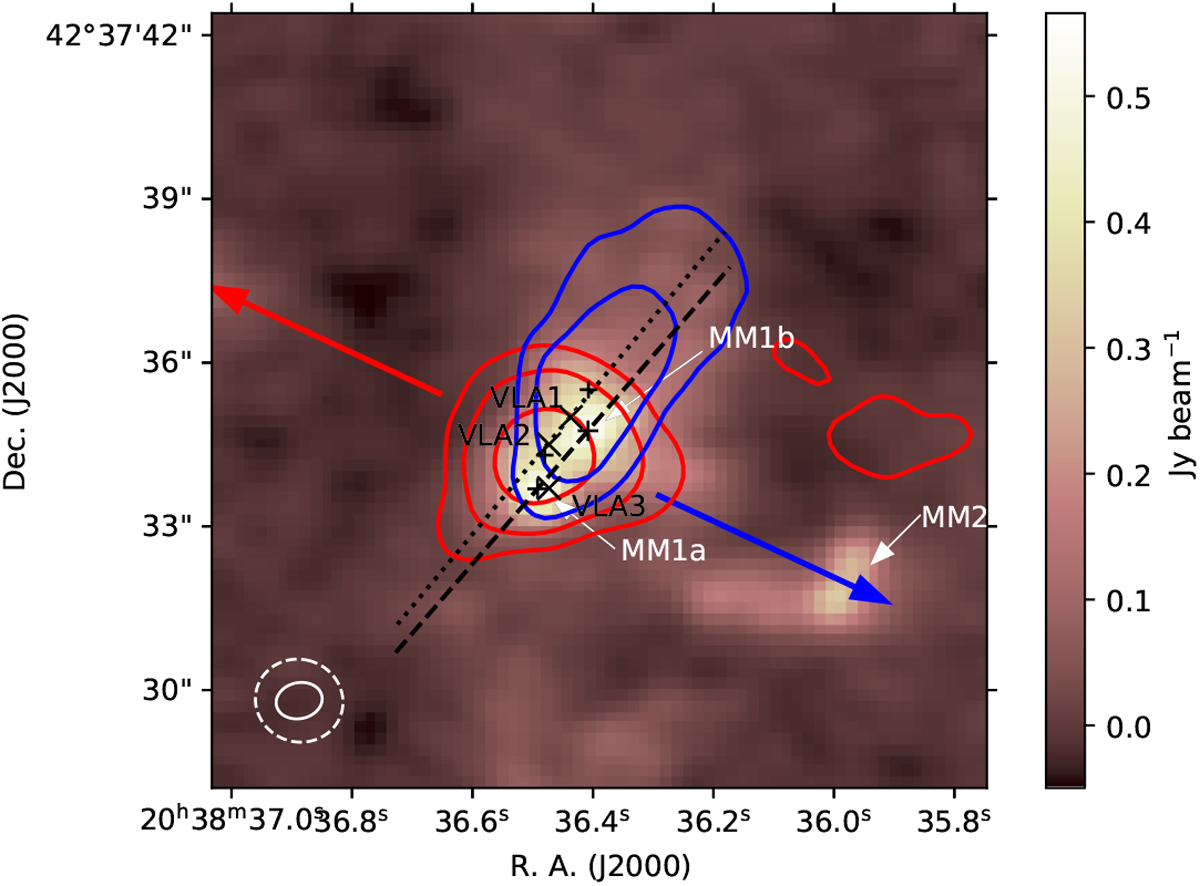
Fig. 3
Download original image
Continuum image of N30, with the red and blueshifted 351.77 GHz H2CO, J = 51,5−41,4, transition shown in contours. The blueshifted component shows more concentrated emission along the outflow axis (represented with a dotted line, running nearly parallel to the axis through the continuum peaks, representedwith a dashed line), while the redshifted emission is slightly more extended perpendicular to the outflow axis, with some emission to the north of the MM2 continuum core. The velocity ranges extend to ±14.25 km s−1 from the systemic velocity of 9.5 km s−1. Beam sizes are shown in the bottom left corner, and are 0′′.85 × 0′′.66, with PA = 12.1°, for the continuum, and 1′′.61 × 1′′.51, PA = 162.24°, for the molecular emission. Contour levels are at 3σ, 6σ, and 12σ. The blue and red arrows represent the large-scale CO emission.
Current usage metrics show cumulative count of Article Views (full-text article views including HTML views, PDF and ePub downloads, according to the available data) and Abstracts Views on Vision4Press platform.
Data correspond to usage on the plateform after 2015. The current usage metrics is available 48-96 hours after online publication and is updated daily on week days.
Initial download of the metrics may take a while.